Uncategorized
The rise of forebearance, the fall of prepayments in RPLs
admin | April 26, 2019
This material is a Marketing Communication and does not constitute Independent Investment Research.
Prepayment speeds have slowed noticeably in newer vintage private-label MBS backed by reperforming loans, and one significant likely cause is the growing amount of forbearance included in these transactions. The percentage of deal principal coming from forbearance has gone from 0% to 4% in the early years of RPLs to 8% to 13% lately. Given comparable WACs, RPLs with forbearance have prepaid significantly slower than those without. Speed differences across RPL vintages should not only effect yield and average life, but the pace of deleveraging, prospects for upgrades and total return, too.
More RPLs sourced from the GSEs
The amount of forbearance securitized in private-label RPL deals generally has been increasing, putting them more in-line with Freddie Mac’s RPL transactions. This looks due in large part to the rising share of RPLs in private deals sourced from the GSEs. Between 2014 and 2018, balances of modified 1-4 family RPLs on commercial bank balance sheets have fallen from nearly $70 billion to just over $30 billion. By comparison, the GSEs collectively held nearly $140 billion in performing RPLs as of the end of last year. If a growing share of loans going into private label RPL transactions are sourced from the GSEs, it’s reasonable to expect the disparity between the amount of forbearance in private and GSE RPL deals to converge.
Exhibit 1: Balances of performing RPLs across banks and the GSEs
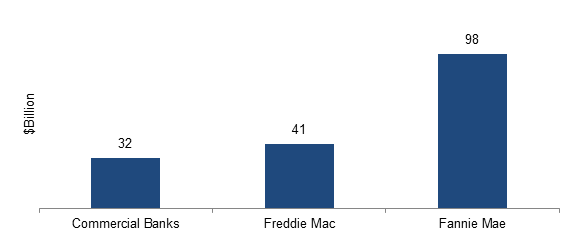
Source: SNL Financial, Fannie Mae, Freddie Mac balances as of 12/31/2018.
A clear correlation between forbearance share and prepayment speed
GSEs deals, particularly earlier vintages, have significantly higher percentages of securitized forbearance and slower prepayment speeds than early private label RPL deals. However, as concentrations of loans with forbearance in private label RPL deals have risen over time, speeds have fallen (Exhibit 2). Deals with 0% to 4% reperforming principal have prepaid since early 2017 above 10 CRR while deals with 10% or more in reperforming principal have prepaid below 8 CRR.
Exhibit 2: Speeds on RPL deals tend to fall as forebearance balances rise
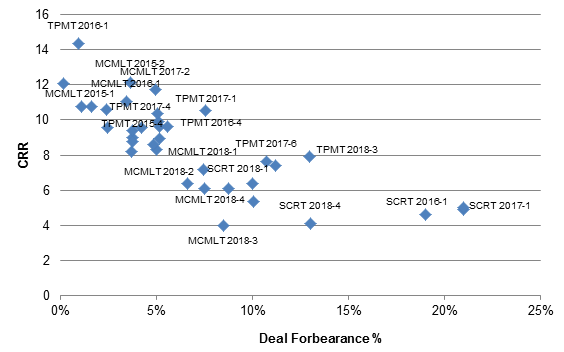
Note: Data show average voluntary CRR between January 2017 and March 2019. That window captures more months of prepayments on older deals than on newer ones. However, since RPLs typically come to market with significant seasoning, there’s usually no ramp or steady rise in speeds after issuance. The difference in number of months of prepayments should not bias the comparison. Source: Intex, Amherst Insight Labs, Amherst Pierpont Securities
While there appears to be a clear connection between the amount of forbearance in a deal and the level of prepayments, there may be a number of collateral attributes also contributing to slower speeds. Loan rate, amortization terms and levels of borrower equity will obviously all contribute to a borrowers’ propensity or ability to prepay. However, comparing loans with similar WAC but with and without forbearance suggests that loans with forbearance prepay significantly slower than loans without (Exhibit 3). It is not a surprising result. Forbearance often comes as a last resort, signaling a loan deeply underwater or a borrower with limited means to repay. More importantly, a loan with forbearance obviously pays 0% on part of the debt. Refinancing would result in the borrower paying interest on that interest-free balance. Even if the remaining balance carries a high rate, interest rates would have to drop significantly to result in a lower all-in monthly payment.
Exhibit 3: Loans with forebearance prepay significantly slower in RPL deals
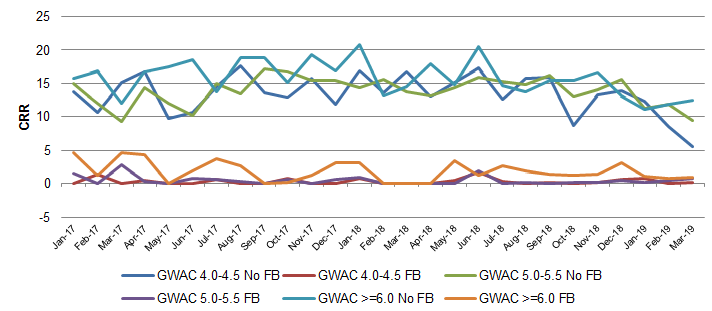
Source: Amherst Insight Labs, Amherst Pierpont Sample is exclusive to TPMT shelf
Increasing amounts of balance modifications may not be the only factor driving slower prepayments. For instance, there has been a pronounced decline in average loan balances across the MCMLT shelf since issuance. Average loan sizes in 2015 issuance on the shelf were in excess of $300,000 and fell consistently below $200,000 in their four 2018 deals. And while likely less of a driver, original FICOs have fallen by as much as 50 points from 2015 to 2018 issuance. While a less consistent trend, average WACs after factoring in non-interest bearing balances across the TPMT shelf have trended lower over time. The slowest observed prepayments across the TPMT shelf are in their two 2017 Freddie Mac seller financed ‘SLST’ transactions, which had the highest amount of securitized forbearance across the shelf’s issuance at 19% and 18% in the FRE1 and FRE2 deals respectively. These deals have average WACs of roughly 3.25% after adjusting for securitized forbearance and are prepaying in the low single digits.
Some risk for credit
It’s important to note that the impact of forbearance in new RPL deals differs from the impact on legacy private-label MBS. In a majority of legacy private-label MBS, forbearance is taken as a loss to the trust when the balance modification takes place and offers upside to the remaining cash flow if it is partly or wholly recovered. In both new private-label and GSE RPL transactions, forbearance is securitized in the principal balance. Given this, a lack of recovery would result in a loss to the trust. Growing amounts of non-performing balances may not only be a prepayment concern but a credit concern as well.
Investment Implications
Increased forbearance and the correlated slowdown in prepayments could have meaningful implications for investors in private-label RPL transactions. Given the sequential nature of the structure, a significant source of potential return comes as the deals prepay and delever. With deleveraging, mezzanine and subordinate bonds will likely get upgraded and trade to tighter spread. Because of the sequential structures, these bonds have significant spread duration and price appreciation associated with deleveraging and upgrade can be significant especially in lower investment grade and non-investment grade classes. A material slowdown in prepayment speeds would slow the rate at which these deals delever, slowing any potential upgrades. Given this, total return investors may favor earlier vintage transactions with smaller amounts of forbearance than more recent transactions with greater amounts.
This material is intended only for institutional investors and does not carry all of the independence and disclosure standards of retail debt research reports. In the preparation of this material, the author may have consulted or otherwise discussed the matters referenced herein with one or more of SCM’s trading desks, any of which may have accumulated or otherwise taken a position, long or short, in any of the financial instruments discussed in or related to this material. Further, SCM may act as a market maker or principal dealer and may have proprietary interests that differ or conflict with the recipient hereof, in connection with any financial instrument discussed in or related to this material.
This message, including any attachments or links contained herein, is subject to important disclaimers, conditions, and disclosures regarding Electronic Communications, which you can find at https://portfolio-strategy.apsec.com/sancap-disclaimers-and-disclosures.
Important Disclaimers
Copyright © 2026 Santander US Capital Markets LLC and its affiliates (“SCM”). All rights reserved. SCM is a member of FINRA and SIPC. This material is intended for limited distribution to institutions only and is not publicly available. Any unauthorized use or disclosure is prohibited.
In making this material available, SCM (i) is not providing any advice to the recipient, including, without limitation, any advice as to investment, legal, accounting, tax and financial matters, (ii) is not acting as an advisor or fiduciary in respect of the recipient, (iii) is not making any predictions or projections and (iv) intends that any recipient to which SCM has provided this material is an “institutional investor” (as defined under applicable law and regulation, including FINRA Rule 4512 and that this material will not be disseminated, in whole or part, to any third party by the recipient.
The author of this material is an economist, desk strategist or trader. In the preparation of this material, the author may have consulted or otherwise discussed the matters referenced herein with one or more of SCM’s trading desks, any of which may have accumulated or otherwise taken a position, long or short, in any of the financial instruments discussed in or related to this material. Further, SCM or any of its affiliates may act as a market maker or principal dealer and may have proprietary interests that differ or conflict with the recipient hereof, in connection with any financial instrument discussed in or related to this material.
This material (i) has been prepared for information purposes only and does not constitute a solicitation or an offer to buy or sell any securities, related investments or other financial instruments, (ii) is neither research, a “research report” as commonly understood under the securities laws and regulations promulgated thereunder nor the product of a research department, (iii) or parts thereof may have been obtained from various sources, the reliability of which has not been verified and cannot be guaranteed by SCM, (iv) should not be reproduced or disclosed to any other person, without SCM’s prior consent and (v) is not intended for distribution in any jurisdiction in which its distribution would be prohibited.
In connection with this material, SCM (i) makes no representation or warranties as to the appropriateness or reliance for use in any transaction or as to the permissibility or legality of any financial instrument in any jurisdiction, (ii) believes the information in this material to be reliable, has not independently verified such information and makes no representation, express or implied, with regard to the accuracy or completeness of such information, (iii) accepts no responsibility or liability as to any reliance placed, or investment decision made, on the basis of such information by the recipient and (iv) does not undertake, and disclaims any duty to undertake, to update or to revise the information contained in this material.
Unless otherwise stated, the views, opinions, forecasts, valuations, or estimates contained in this material are those solely of the author, as of the date of publication of this material, and are subject to change without notice. The recipient of this material should make an independent evaluation of this information and make such other investigations as the recipient considers necessary (including obtaining independent financial advice), before transacting in any financial market or instrument discussed in or related to this material.
Important disclaimers for clients in the EU and UK
This publication has been prepared by Trading Desk Strategists within the Sales and Trading functions of Santander US Capital Markets LLC (“SanCap”), the US registered broker-dealer of Santander Corporate & Investment Banking. This communication is distributed in the EEA by Banco Santander S.A., a credit institution registered in Spain and authorised and regulated by the Bank of Spain and the CNMV. Any EEA recipient of this communication that would like to affect any transaction in any security or issuer discussed herein should do so with Banco Santander S.A. or any of its affiliates (together “Santander”). This communication has been distributed in the UK by Banco Santander, S.A.’s London branch, authorised by the Bank of Spain and subject to regulatory oversight on certain matters by the Financial Conduct Authority (FCA) and the Prudential Regulation Authority (PRA).
The publication is intended for exclusive use for Professional Clients and Eligible Counterparties as defined by MiFID II and is not intended for use by retail customers or for any persons or entities in any jurisdictions or country where such distribution or use would be contrary to local law or regulation.
This material is not a product of Santander´s Research Team and does not constitute independent investment research. This is a marketing communication and may contain ¨investment recommendations¨ as defined by the Market Abuse Regulation 596/2014 ("MAR"). This publication has not been prepared in accordance with legal requirements designed to promote the independence of research and is not subject to any prohibition on dealing ahead of the dissemination of investment research. The author, date and time of the production of this publication are as indicated herein.
This publication does not constitute investment advice and may not be relied upon to form an investment decision, nor should it be construed as any offer to sell or issue or invitation to purchase, acquire or subscribe for any instruments referred herein. The publication has been prepared in good faith and based on information Santander considers reliable as of the date of publication, but Santander does not guarantee or represent, express or implied, that such information is accurate or complete. All estimates, forecasts and opinions are current as at the date of this publication and are subject to change without notice. Unless otherwise indicated, Santander does not intend to update this publication. The views and commentary in this publication may not be objective or independent of the interests of the Trading and Sales functions of Santander, who may be active participants in the markets, investments or strategies referred to herein and/or may receive compensation from investment banking and non-investment banking services from entities mentioned herein. Santander may trade as principal, make a market or hold positions in instruments (or related derivatives) and/or hold financial interest in entities discussed herein. Santander may provide market commentary or trading strategies to other clients or engage in transactions which may differ from views expressed herein. Santander may have acted upon the contents of this publication prior to you having received it.
This publication is intended for the exclusive use of the recipient and must not be reproduced, redistributed or transmitted, in whole or in part, without Santander’s consent. The recipient agrees to keep confidential at all times information contained herein.


