Uncategorized
Active share keeps delivering healthy returns
admin | April 26, 2019
This material is a Marketing Communication and does not constitute Independent Investment Research.
Fee pressure has made delivering excess return on benchmarked portfolios arguably more important than ever before, but generating excess typically takes more than just a few tweaks to asset mix or security selection. It usually means stepping well away from the benchmark, which may not be for the faint of heart. Returns on US mutual funds benchmarked to fixed income in the last year are just the latest clear example.
Of the 32 US fixed income mutual funds or ETFs with more than $10 billion in assets, the ones that swung asset allocation away from the benchmark the most were also the ones that delivered the most excess return. On a scale from zero to 100, where zero means no difference between fund and benchmark asset allocation and 100 means complete difference, funds generally needed a score of 50 or more to start showing alpha (Exhibit 1). That means that half the asset allocation or more had to differ from the index. The nine funds managing $377 billion with scores above 50 showed an asset-weighted alpha of 8.1 bp; the 19 funds managing $578 billion with scores below 50 showed an asset-weighted alpha of 0 bp.
Exhibit 1: Alpha improved as funds moved away from benchmark allocation
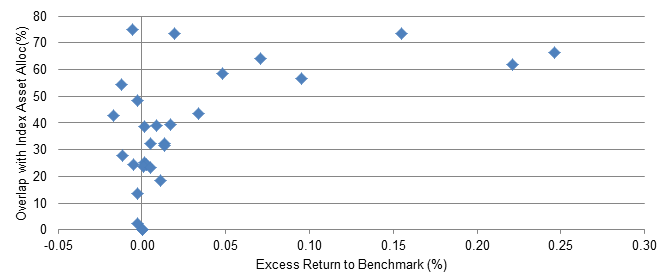
Note: Data reflect returns on US funds screened on Bloomberg to have the Bloomberg/Barclays Aggregate Bond Market Index as primary benchmark and at least $10 billion in AUM. Of the 32 funds identified,30 had sufficient data for analysis. Excess return reflects weekly performance against the primary benchmark ending April 19, 2019. Overlap with benchmark asset allocation calculated as a distance measure with [SUM(Fund Allocation to Asset Class X – Benchmark Allocation to Asset Class X)^2]^(0.5). Source: Bloomberg, Amherst Pierpont Securities calculations.
The road to alpha took different routes, but the five funds with the highest alpha also had the highest allocation to equity and corporate debt (Exhibit 2). Equity might not seem obvious for a fund benchmarked primarily to a bond index, but investment guidelines can offer broad flexibility. The generally lower correlation of equity to fixed income creates a more diversified portfolio and often helps lift excess return against a fixed income benchmark. Of the funds with no equity, higher alpha was slightly correlated—but only slightly—with going overweight corporates, mortgages or preferred debt and underweight Treasury debt. That means some portfolios swung for the fences in these assets and ended up negative.
Exhibit 2: Overweights in equity, corporate debt and MBS helped alpha
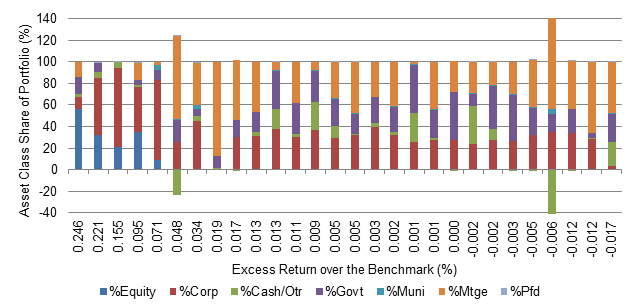
Note: Data reflect returns on US funds screened on Bloomberg to have the Bloomberg/Barclays Aggregate Bond Market Index as primary benchmark and at least $10 billion in AUM. Excess return reflects weekly performance against the primary benchmark ending April 19, 2019. Asset allocation based on Bloomberg algorithm. Source: Bloomberg, Amherst Pierpont Securities calculations.
It’s worth noting that this level of analysis only addresses broad asset allocation and not the potential gains from security selection within an asset classes, from out-of-index exposures or from other strategies. These are other roads to alpha that could have contributed to these results, too.
For veterans of the benchmarking wars, these results may come as no surprise. Since Martijn Cremers and Antti Petajisto at Yale first asked How Active is Your Fund Manager? A New Measure That Predicts Performance, investors have focused on the tendency of investment performance to improve as managers either allocate away from benchmark asset class weightings or go strongly overweight or underweight securities within an asset class. Cremers and Petajisto found that differing from a benchmark often by 50% or more is essential to beating it. Managing against a benchmark is not for the timid.
The pressure to show a high active portfolio share clearly increases as the fees on benchmark returns fall. High active share broadly worked over the last 12 months. With passive funds and ETFs making the falling price of benchmark performance increasingly clear, asset managers will likely have to keep looking for relative value opportunities and other exposures that keep them ahead of the crowd.
***
The view in rates
Rates sold off through the first half of April, but reversed course over the last two weeks, retracing most of the move. Q1 GDP surprised to the high side, but that was partially based on an inventory build that will likely be reversed in Q2. Underlying inflation data was also weak, now threatening to drop to 1.6%, falling below the Fed’s 2.0% target. This has markets speculating on the chance of two rate cuts by year end.
The yield on 2-year notes has dropped to 2.28%, consistent with nearly two Fed rate cuts over the next two years. That suggests a Fed willing to defend growth, or act solely to stimulate inflation. That first seems realistic if growth slows below 2.0%, which appears increasingly unlikely. The latter seems unnecessary at current levels, though it’s unclear what threshold inflation would need to breach for the Fed to consider a standalone move.
The view in spreads
Relatively low volatility and heavy net Treasury supply should help spread products tighten. The corporate market still has issues with leverage in investment grade debt and loose underwriting in leveraged loans; a slowing economy should put pressure on those sectors. But corporate management is starting to deleverage. Still, credit concerns linger. Agency MBS should broadly outperform corporate debt, with investment grade in particular looking tired.
The view in credit
Companies have started to divert cash flow toward paying down debt, have started to sell non-core assets and have curtailed stock buybacks. Management has heard the concerns of debt investors. Households continue to look strong with low unemployment, rising home prices, and generally good performance in investment portfolios.
This material is intended only for institutional investors and does not carry all of the independence and disclosure standards of retail debt research reports. In the preparation of this material, the author may have consulted or otherwise discussed the matters referenced herein with one or more of SCM’s trading desks, any of which may have accumulated or otherwise taken a position, long or short, in any of the financial instruments discussed in or related to this material. Further, SCM may act as a market maker or principal dealer and may have proprietary interests that differ or conflict with the recipient hereof, in connection with any financial instrument discussed in or related to this material.
This message, including any attachments or links contained herein, is subject to important disclaimers, conditions, and disclosures regarding Electronic Communications, which you can find at https://portfolio-strategy.apsec.com/sancap-disclaimers-and-disclosures.
Important Disclaimers
Copyright © 2026 Santander US Capital Markets LLC and its affiliates (“SCM”). All rights reserved. SCM is a member of FINRA and SIPC. This material is intended for limited distribution to institutions only and is not publicly available. Any unauthorized use or disclosure is prohibited.
In making this material available, SCM (i) is not providing any advice to the recipient, including, without limitation, any advice as to investment, legal, accounting, tax and financial matters, (ii) is not acting as an advisor or fiduciary in respect of the recipient, (iii) is not making any predictions or projections and (iv) intends that any recipient to which SCM has provided this material is an “institutional investor” (as defined under applicable law and regulation, including FINRA Rule 4512 and that this material will not be disseminated, in whole or part, to any third party by the recipient.
The author of this material is an economist, desk strategist or trader. In the preparation of this material, the author may have consulted or otherwise discussed the matters referenced herein with one or more of SCM’s trading desks, any of which may have accumulated or otherwise taken a position, long or short, in any of the financial instruments discussed in or related to this material. Further, SCM or any of its affiliates may act as a market maker or principal dealer and may have proprietary interests that differ or conflict with the recipient hereof, in connection with any financial instrument discussed in or related to this material.
This material (i) has been prepared for information purposes only and does not constitute a solicitation or an offer to buy or sell any securities, related investments or other financial instruments, (ii) is neither research, a “research report” as commonly understood under the securities laws and regulations promulgated thereunder nor the product of a research department, (iii) or parts thereof may have been obtained from various sources, the reliability of which has not been verified and cannot be guaranteed by SCM, (iv) should not be reproduced or disclosed to any other person, without SCM’s prior consent and (v) is not intended for distribution in any jurisdiction in which its distribution would be prohibited.
In connection with this material, SCM (i) makes no representation or warranties as to the appropriateness or reliance for use in any transaction or as to the permissibility or legality of any financial instrument in any jurisdiction, (ii) believes the information in this material to be reliable, has not independently verified such information and makes no representation, express or implied, with regard to the accuracy or completeness of such information, (iii) accepts no responsibility or liability as to any reliance placed, or investment decision made, on the basis of such information by the recipient and (iv) does not undertake, and disclaims any duty to undertake, to update or to revise the information contained in this material.
Unless otherwise stated, the views, opinions, forecasts, valuations, or estimates contained in this material are those solely of the author, as of the date of publication of this material, and are subject to change without notice. The recipient of this material should make an independent evaluation of this information and make such other investigations as the recipient considers necessary (including obtaining independent financial advice), before transacting in any financial market or instrument discussed in or related to this material.
Important disclaimers for clients in the EU and UK
This publication has been prepared by Trading Desk Strategists within the Sales and Trading functions of Santander US Capital Markets LLC (“SanCap”), the US registered broker-dealer of Santander Corporate & Investment Banking. This communication is distributed in the EEA by Banco Santander S.A., a credit institution registered in Spain and authorised and regulated by the Bank of Spain and the CNMV. Any EEA recipient of this communication that would like to affect any transaction in any security or issuer discussed herein should do so with Banco Santander S.A. or any of its affiliates (together “Santander”). This communication has been distributed in the UK by Banco Santander, S.A.’s London branch, authorised by the Bank of Spain and subject to regulatory oversight on certain matters by the Financial Conduct Authority (FCA) and the Prudential Regulation Authority (PRA).
The publication is intended for exclusive use for Professional Clients and Eligible Counterparties as defined by MiFID II and is not intended for use by retail customers or for any persons or entities in any jurisdictions or country where such distribution or use would be contrary to local law or regulation.
This material is not a product of Santander´s Research Team and does not constitute independent investment research. This is a marketing communication and may contain ¨investment recommendations¨ as defined by the Market Abuse Regulation 596/2014 ("MAR"). This publication has not been prepared in accordance with legal requirements designed to promote the independence of research and is not subject to any prohibition on dealing ahead of the dissemination of investment research. The author, date and time of the production of this publication are as indicated herein.
This publication does not constitute investment advice and may not be relied upon to form an investment decision, nor should it be construed as any offer to sell or issue or invitation to purchase, acquire or subscribe for any instruments referred herein. The publication has been prepared in good faith and based on information Santander considers reliable as of the date of publication, but Santander does not guarantee or represent, express or implied, that such information is accurate or complete. All estimates, forecasts and opinions are current as at the date of this publication and are subject to change without notice. Unless otherwise indicated, Santander does not intend to update this publication. The views and commentary in this publication may not be objective or independent of the interests of the Trading and Sales functions of Santander, who may be active participants in the markets, investments or strategies referred to herein and/or may receive compensation from investment banking and non-investment banking services from entities mentioned herein. Santander may trade as principal, make a market or hold positions in instruments (or related derivatives) and/or hold financial interest in entities discussed herein. Santander may provide market commentary or trading strategies to other clients or engage in transactions which may differ from views expressed herein. Santander may have acted upon the contents of this publication prior to you having received it.
This publication is intended for the exclusive use of the recipient and must not be reproduced, redistributed or transmitted, in whole or in part, without Santander’s consent. The recipient agrees to keep confidential at all times information contained herein.


