Uncategorized
MBS: LTV and DTI rise in prime jumbo RMBS, balances fall
admin | April 12, 2019
This material is a Marketing Communication and does not constitute Independent Investment Research.
Prime jumbo RMBS continue to add to a tail of credit risk through loans with higher loan-to-value and debt-to-income ratios. Although still a small part of overall exposure, high LTV principal from 2017 to 2018 increased by nearly 250%. And high DTI loans also more than doubled. There has been little to no slippage in borrower credit scores or underwriting as lower FICO or limited documentation borrowers are virtually non-existent in these deals. Prepayment risk has actually marginally declined. Pricing on prime jumbo RMBS suggests investors have limited if any concern about the shifting risks.
More loans above 90 LTV
Prime jumbo issuance totaled roughly $30 billion last year, dwarfing other private RMBS and nearly tripling the prior year’s issuance. Growth in prime jumbo has been spurred by a host of factors. Better private-label execution on certain conforming loans has been a key driver . Additionally, as deposit rates have risen, securitization for banks has become an increasingly viable alternative to holding the loans.
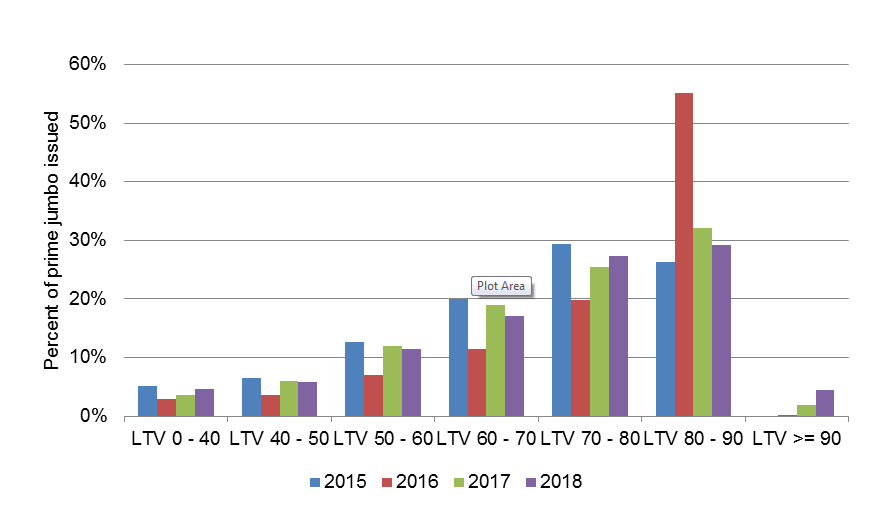
Rising home prices have likely contributed to higher LTV and DTI loans. But this is evident in both agency and expanded credit lending as well. Loans with original CLTVs greater than 90 were relatively non-existent in prime jumbo deals issued in 2016, made up just 2% of all securitized prime jumbo volumes in 2017 and jumped to 4.5% last year. While this has been offset to some degree by a decline in 80 to 90 LTV loans, the growing tail above 90 LTV loans could suggest the need for an increase in risk premiums in thinner, less enhanced mezzanine and subordinate bonds. (Exhibit 1)
Exhibit 1: Average original combined LTV across prime jumbo issuance
Source: Amherst Insight Labs, Amherst Pierpont
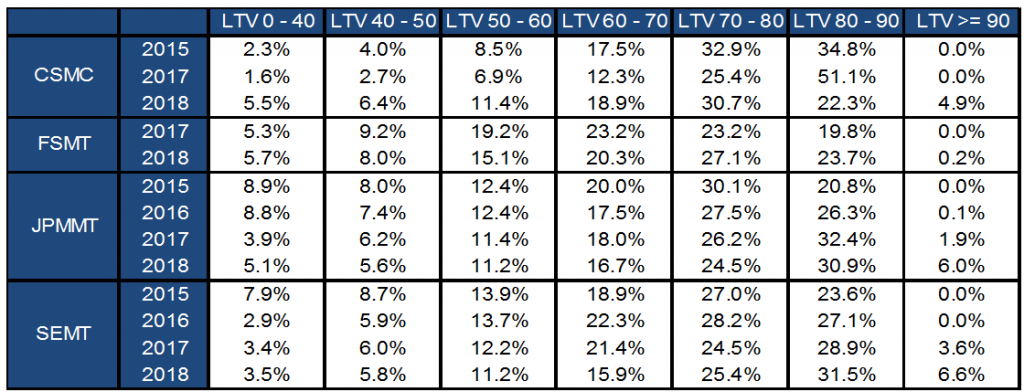
The increase in high LTV loans has been fairly uniform across major prime jumbo issuers ranging from roughly 5% to 6.5% of total 2018 issuance across the CSMC, JPMMT and SEMT shelves. While the tail may be growing, there does not appear to be layered risk as average FICO scores remain strong, ranging from 747 on the CSMC shelf to 786 on Redwood’s SEMT issuance. (Exhibit 2)
Exhibit 2: LTV distribution by issuer and vintage
Source: Amherst Insight Labs, Amherst Pierpont
A rise in DTIs above 45
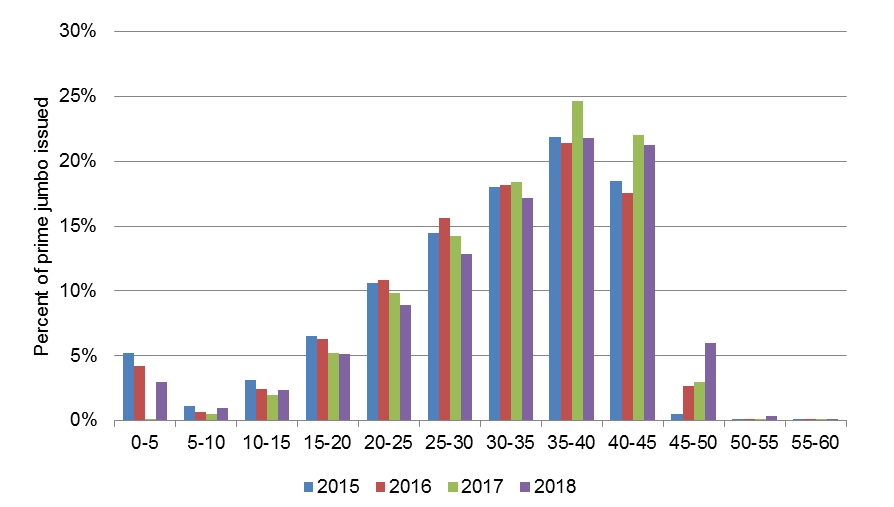
Borrower leverage is not only increasing in the form of higher LTVs, as the populations of higher DTI loans are increasing as well. Loans with DTIs between 45 and 50 have grown from 2.7% of total issuance volume in 2016 to 6.0% of last year’s issuance. Higher DTI loans tend to have modestly lower LTV ratios. Loans securitized in 2018 with DTIs between 45 and 50 had an average LTV of 68, three points lower than the broader vintage. (Exhibit 3)
Exhibit 3: Average DTI across prime jumbo issuance
Source: Amherst Insight Labs, Amherst Pierpont
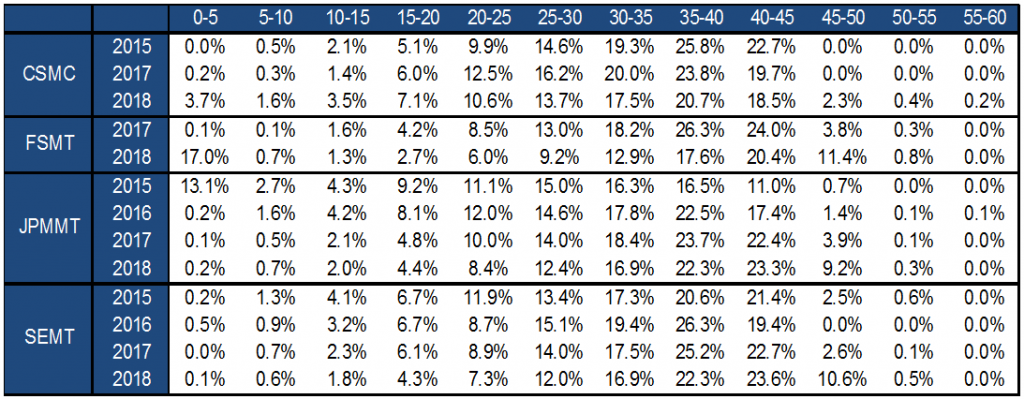
The populations of higher DTI loans were fairly uniform across major issuers last year as loans with DTIs ranging from 45 to 50 comprised roughly 10% of all collateral with the notable exception of the CSMC shelf where high DTI collateral made up just 2% of last year’s volumes. Year to date issuance appears to fairly consistent with last year with 45 to 50 DTI loans making up 9% of all collateral issued in the first quarter. Higher DTI loans across major issuers generally had modestly lower than average LTVs and higher than average FICOs with only the CSMC shelf showing modestly more layered risk albeit in a far smaller population of higher DTI loans than other issuers. (Exhibit 4)
Exhibit 4: DTI distribution across issuer and vintage
Source: Amherst Insight Labs, Amherst Pierpont
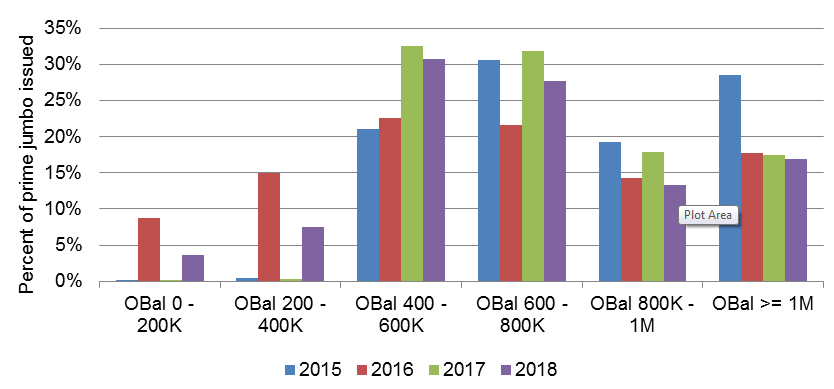
Falling loan balances
While the tail of credit risk has grown slightly, the tail of prepayment risk as declined. The population of higher balance loans in prime securitizations has actually decreased. Super jumbo loans with balances greater than $1 million made up nearly a third of total collateral in 2015 and fell to roughly half that amount last year. In contrast, loans with balances between $400 and $600 thousand, which roughly align to jumbo conforming limits jumped by 50% between 2015 and 2018 from 21% to 31%. Conforming balance volumes as a percentage of total issuance peaked in 2016, making up nearly a quarter of total issuance. Those loans made up 12% of total collateral last year. However total issuance in 2018 was more than triple that of 2016 meaning a billion more in conforming balance collateral made its way into private-label deals in 2018 than in 2016. (Exhibit 5)
Exhibit 5: Loan balance distribution by vintage
Source: Amherst Insight Labs, Amherst Pierpont
Little shift in compensation for shifts in risk
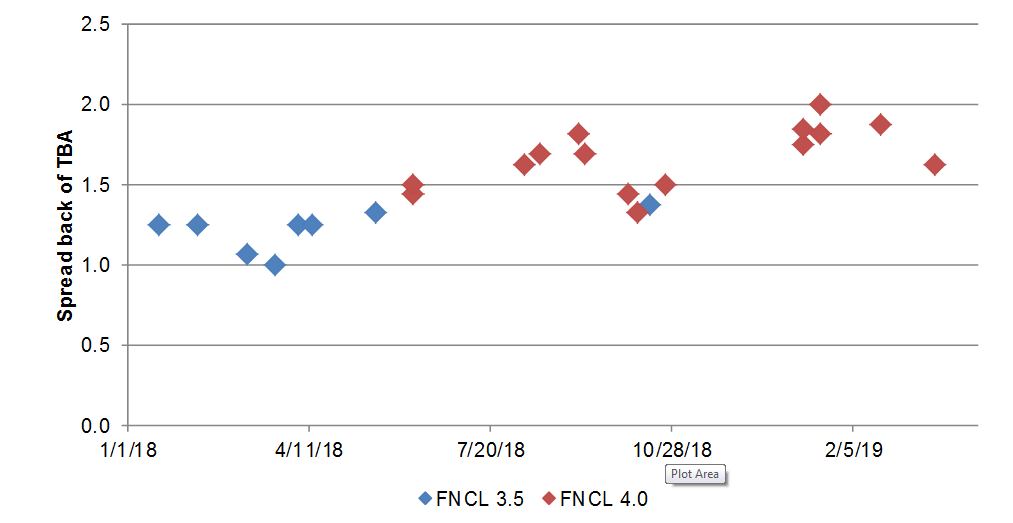
While tail risk in prime jumbo credit may be increasing, there has been little in the way of increased compensation for that risk – at least at the top of the capital structure. The lack of increase in risk premiums is most likely driven by the belief that despite increased tail risk, cumulative losses to these pools will continue to be small coupled with the fact that AAA pass-throughs often carry up to two times the credit enhancement required for a AAA rating and as such are likely extremely loss remote. That being said, even a modest downturn in what to date has been pristine collateral performance would likely drive spreads wider. While we did see some widening in AAA pass-through spreads late last year into the first quarter of this year, we would attribute that to a general widening across risk assets and less so a reaction to a change in the risk profile of the asset. Spreads on 4% coupon super-senior pass-throughs traded as wide as two points back of their TBA counterpart in January of this year and have tightened by half a point since then. Increased compensation for growing tail risk would likely be more evident in newer vintage prime AAA mezzanine and subordinate bonds but AAA mezzanine bonds have tightened one for one with super seniors and spreads on the subordinate stack are unchanged to slightly tighter since the beginning of the year.
Exhibit 6: Prime jumbo AAA super senior pass-through spreads
Source: Amherst Insight Labs, Amherst Pierpont
This material is intended only for institutional investors and does not carry all of the independence and disclosure standards of retail debt research reports. In the preparation of this material, the author may have consulted or otherwise discussed the matters referenced herein with one or more of SCM’s trading desks, any of which may have accumulated or otherwise taken a position, long or short, in any of the financial instruments discussed in or related to this material. Further, SCM may act as a market maker or principal dealer and may have proprietary interests that differ or conflict with the recipient hereof, in connection with any financial instrument discussed in or related to this material.
This message, including any attachments or links contained herein, is subject to important disclaimers, conditions, and disclosures regarding Electronic Communications, which you can find at https://portfolio-strategy.apsec.com/sancap-disclaimers-and-disclosures.
Important Disclaimers
Copyright © 2026 Santander US Capital Markets LLC and its affiliates (“SCM”). All rights reserved. SCM is a member of FINRA and SIPC. This material is intended for limited distribution to institutions only and is not publicly available. Any unauthorized use or disclosure is prohibited.
In making this material available, SCM (i) is not providing any advice to the recipient, including, without limitation, any advice as to investment, legal, accounting, tax and financial matters, (ii) is not acting as an advisor or fiduciary in respect of the recipient, (iii) is not making any predictions or projections and (iv) intends that any recipient to which SCM has provided this material is an “institutional investor” (as defined under applicable law and regulation, including FINRA Rule 4512 and that this material will not be disseminated, in whole or part, to any third party by the recipient.
The author of this material is an economist, desk strategist or trader. In the preparation of this material, the author may have consulted or otherwise discussed the matters referenced herein with one or more of SCM’s trading desks, any of which may have accumulated or otherwise taken a position, long or short, in any of the financial instruments discussed in or related to this material. Further, SCM or any of its affiliates may act as a market maker or principal dealer and may have proprietary interests that differ or conflict with the recipient hereof, in connection with any financial instrument discussed in or related to this material.
This material (i) has been prepared for information purposes only and does not constitute a solicitation or an offer to buy or sell any securities, related investments or other financial instruments, (ii) is neither research, a “research report” as commonly understood under the securities laws and regulations promulgated thereunder nor the product of a research department, (iii) or parts thereof may have been obtained from various sources, the reliability of which has not been verified and cannot be guaranteed by SCM, (iv) should not be reproduced or disclosed to any other person, without SCM’s prior consent and (v) is not intended for distribution in any jurisdiction in which its distribution would be prohibited.
In connection with this material, SCM (i) makes no representation or warranties as to the appropriateness or reliance for use in any transaction or as to the permissibility or legality of any financial instrument in any jurisdiction, (ii) believes the information in this material to be reliable, has not independently verified such information and makes no representation, express or implied, with regard to the accuracy or completeness of such information, (iii) accepts no responsibility or liability as to any reliance placed, or investment decision made, on the basis of such information by the recipient and (iv) does not undertake, and disclaims any duty to undertake, to update or to revise the information contained in this material.
Unless otherwise stated, the views, opinions, forecasts, valuations, or estimates contained in this material are those solely of the author, as of the date of publication of this material, and are subject to change without notice. The recipient of this material should make an independent evaluation of this information and make such other investigations as the recipient considers necessary (including obtaining independent financial advice), before transacting in any financial market or instrument discussed in or related to this material.
Important disclaimers for clients in the EU and UK
This publication has been prepared by Trading Desk Strategists within the Sales and Trading functions of Santander US Capital Markets LLC (“SanCap”), the US registered broker-dealer of Santander Corporate & Investment Banking. This communication is distributed in the EEA by Banco Santander S.A., a credit institution registered in Spain and authorised and regulated by the Bank of Spain and the CNMV. Any EEA recipient of this communication that would like to affect any transaction in any security or issuer discussed herein should do so with Banco Santander S.A. or any of its affiliates (together “Santander”). This communication has been distributed in the UK by Banco Santander, S.A.’s London branch, authorised by the Bank of Spain and subject to regulatory oversight on certain matters by the Financial Conduct Authority (FCA) and the Prudential Regulation Authority (PRA).
The publication is intended for exclusive use for Professional Clients and Eligible Counterparties as defined by MiFID II and is not intended for use by retail customers or for any persons or entities in any jurisdictions or country where such distribution or use would be contrary to local law or regulation.
This material is not a product of Santander´s Research Team and does not constitute independent investment research. This is a marketing communication and may contain ¨investment recommendations¨ as defined by the Market Abuse Regulation 596/2014 ("MAR"). This publication has not been prepared in accordance with legal requirements designed to promote the independence of research and is not subject to any prohibition on dealing ahead of the dissemination of investment research. The author, date and time of the production of this publication are as indicated herein.
This publication does not constitute investment advice and may not be relied upon to form an investment decision, nor should it be construed as any offer to sell or issue or invitation to purchase, acquire or subscribe for any instruments referred herein. The publication has been prepared in good faith and based on information Santander considers reliable as of the date of publication, but Santander does not guarantee or represent, express or implied, that such information is accurate or complete. All estimates, forecasts and opinions are current as at the date of this publication and are subject to change without notice. Unless otherwise indicated, Santander does not intend to update this publication. The views and commentary in this publication may not be objective or independent of the interests of the Trading and Sales functions of Santander, who may be active participants in the markets, investments or strategies referred to herein and/or may receive compensation from investment banking and non-investment banking services from entities mentioned herein. Santander may trade as principal, make a market or hold positions in instruments (or related derivatives) and/or hold financial interest in entities discussed herein. Santander may provide market commentary or trading strategies to other clients or engage in transactions which may differ from views expressed herein. Santander may have acted upon the contents of this publication prior to you having received it.
This publication is intended for the exclusive use of the recipient and must not be reproduced, redistributed or transmitted, in whole or in part, without Santander’s consent. The recipient agrees to keep confidential at all times information contained herein.


