Uncategorized
Economy: Financial conditions and the Fed put
admin | April 12, 2019
This material is a Marketing Communication and does not constitute Independent Investment Research.
Financial conditions tightened in late 2018, helping spark a sharp shift in Fed policy. Those tighter conditions (discussed here) broadly resembled market hiccups of mid- 2015 and early 2016 but fell well short of 1998, which ultimately resulted in 75 bp of Fed easing. Three months later, conditions have eased considerably with stock prices higher and risk spreads narrower even though Treasury yields remain well below last fall’s levels. The shift in Fed policy should get some credit for the easier conditions, but the dance between the Fed and markets could get complicated if growth, as expected, starts to improve.
The Chicago Fed Financial Conditions Index
My favorite measure of financial conditions is the Chicago Fed’s National Financial Conditions Index (NFCI). It includes more than 100 variables covering interest rate spreads, banks’ lending stance, liquidity measures, asset prices, and debt levels. In a broad context, the tightening of financial conditions seen late last year registers as no more than a slight wiggle over the broad history of the series (Exhibit 1). The current setting of financial conditions is about as easy as any going back to 1990.
Exhibit 1: Chicago Fed National Financial Conditions Index
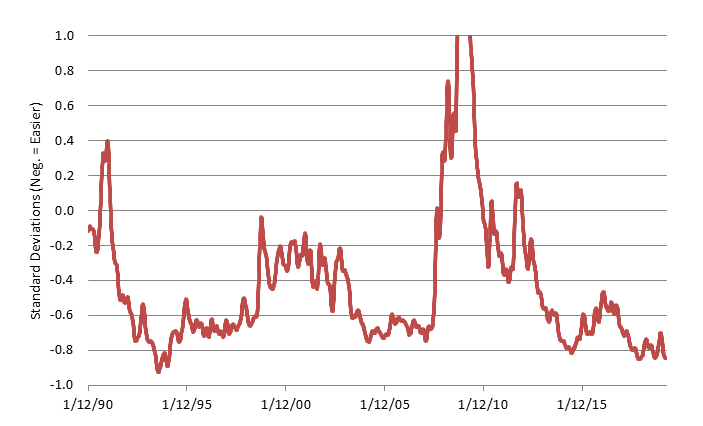
Source: Chicago Fed.
The last six months for the NFCI represent virtually a perfectly symmetric round trip, as the NFCI went from a low (easiest financial conditions) of -0.84 in September to a high (tightest financial conditions) of -0.70 at the end of the year and, as of the latest reading (April 5), is back to -0.84, a 25-year extreme (Exhibit 2).
Exhibit 2: Chicago Fed National Financial Conditions Index
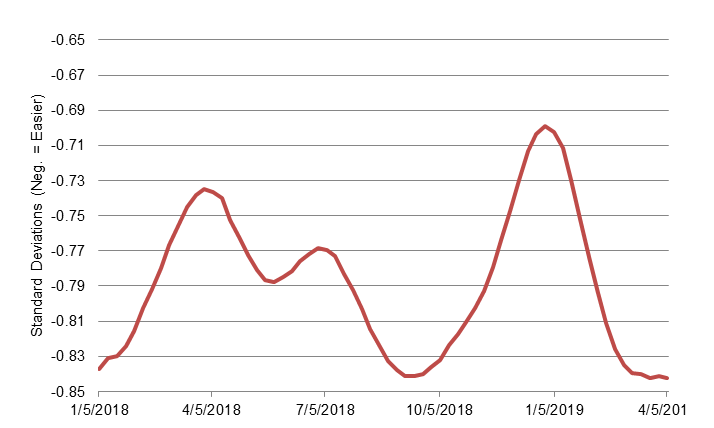
Note: the scale is reversed relative to the NFCI, as easy conditions are represented by positive readings and tight conditions by negative readings. Source: Chicago Fed.
Bloomberg Financial Conditions Index
To the extent that the Chicago Fed NFCI has a flaw, it is that it is so comprehensive that it sometimes is not timely as many of the series included are reported at a monthly or even a quarterly interval. The Financial Conditions Index constructed by Bloomberg is an example of a more streamlined, but also timelier, gauge. It only includes nine variables—TED spread, LIBOR/OIS spread, CP/T-bill spread, Baa/10-year Treasury spread, high yield/10-year Treasury spread, muni/10-year Treasury spread, swaption vol index, S&P 500 and the VIX index—and is calculated daily. The FCI hit a post-financial-crisis-peak at +1.11 in early October, dropped to -1.11 on Christmas Eve and has rebounded to +0.87 as of April 11, recovering 89% of the tightening that occurred late last year (Exhibit 3).
Exhibit 3: Bloomberg Financial Conditions Index

Source: Bloomberg.
Credit for the Fed
It is fair to say that financial conditions have essentially returned to where they were before the noticeable tightening seen in the fourth quarter. The narrative around that round trip, however, depends to a degree on who is telling the story.
One of the most interesting passages in the March FOMC minutes was this sentence: “participants observed that a good deal of the tightening over the latter part of last year in financial conditions had since been reversed; Federal Reserve communications since the beginning of this year were seen as an important contributor to the recent improvements in financial conditions.” In other words, the FOMC wishes to take credit for the easing of financial conditions this year. There is certainly some plausibility to this narrative, as the Fed has taken a starkly more dovish stance regarding the monetary policy outlook, with the median end-2019 dot projection moving from three hikes for 2019 in September 2018 to no change in March 2019.
Financial market expectations have shifted accordingly. At the end of September, the January 2020 fed funds futures contract yielded 2.82%, versus a current reading of 2.24%. At the same time, long-term interest rates have, if anything, moved even more. The yield on 10-year Treasuries has declined from over 3.20% last October to around 2.50% now. Thus, it would be hard to argue that the entire drop in long-term interest rates is a function of changing Fed expectations, but the FOMC can probably take credit for a sizable portion of the recovery.
It is probably more debatable whether the Fed can take credit for the recovery in stock prices and the narrowing in risk spreads. Certainly, the sense that the Fed “has the markets’ back” played a role in the recovery in financial conditions in early 2019, but it is impossible to disentangle that factor from other relevant developments, such as the end of the federal government shutdown and the improved tone of U.S.–China trade negotiations.
Let’s accept for the sake of argument that the Fed can legitimately take credit for most of the recovery in financial conditions. The next question is whether this is entirely a good thing. Fed officials constantly object when market participants claim that there is a Powell Put (or, in the past, Greenspan put or Bernanke put or Yellen put), and yet the FOMC in the latest edition of the minutes seems to be trying to take credit for pretty much exactly that. In any case, various indices suggest that financial conditions are about as easy as they have been at any time since at least the Financial Crisis. That may seem appropriate at the moment, given downside risks that have financial markets worried and the fact that the economy apparently stumbled somewhat in terms of growth in the first quarter.
However, if, as I expect, economic growth recovers in the spring, as it has in prior years after habitually sub-par Q1’s, having such easy financial conditions might not look so good in a few months. Of course, financial conditions – and expectations with respect to the Fed — may change if the economic data improve.
Certainly, when the FCIs were hitting highs last year, there was a very real sense that financial markets were perhaps overheating. We could find ourselves back there pretty quickly if there is a trade agreement and/or real GDP bounces back by more than expected in Q2. In that scenario, it would be interesting to see how sluggish the Fed’s reaction function is, as the central bank historically has been notoriously slow to shift directions when the economy swings stronger or weaker, and whether the financial markets would jump out in front of the Fed or wait and take their cues from the FOMC.
This material is intended only for institutional investors and does not carry all of the independence and disclosure standards of retail debt research reports. In the preparation of this material, the author may have consulted or otherwise discussed the matters referenced herein with one or more of SCM’s trading desks, any of which may have accumulated or otherwise taken a position, long or short, in any of the financial instruments discussed in or related to this material. Further, SCM may act as a market maker or principal dealer and may have proprietary interests that differ or conflict with the recipient hereof, in connection with any financial instrument discussed in or related to this material.
This message, including any attachments or links contained herein, is subject to important disclaimers, conditions, and disclosures regarding Electronic Communications, which you can find at https://portfolio-strategy.apsec.com/sancap-disclaimers-and-disclosures.
Important Disclaimers
Copyright © 2026 Santander US Capital Markets LLC and its affiliates (“SCM”). All rights reserved. SCM is a member of FINRA and SIPC. This material is intended for limited distribution to institutions only and is not publicly available. Any unauthorized use or disclosure is prohibited.
In making this material available, SCM (i) is not providing any advice to the recipient, including, without limitation, any advice as to investment, legal, accounting, tax and financial matters, (ii) is not acting as an advisor or fiduciary in respect of the recipient, (iii) is not making any predictions or projections and (iv) intends that any recipient to which SCM has provided this material is an “institutional investor” (as defined under applicable law and regulation, including FINRA Rule 4512 and that this material will not be disseminated, in whole or part, to any third party by the recipient.
The author of this material is an economist, desk strategist or trader. In the preparation of this material, the author may have consulted or otherwise discussed the matters referenced herein with one or more of SCM’s trading desks, any of which may have accumulated or otherwise taken a position, long or short, in any of the financial instruments discussed in or related to this material. Further, SCM or any of its affiliates may act as a market maker or principal dealer and may have proprietary interests that differ or conflict with the recipient hereof, in connection with any financial instrument discussed in or related to this material.
This material (i) has been prepared for information purposes only and does not constitute a solicitation or an offer to buy or sell any securities, related investments or other financial instruments, (ii) is neither research, a “research report” as commonly understood under the securities laws and regulations promulgated thereunder nor the product of a research department, (iii) or parts thereof may have been obtained from various sources, the reliability of which has not been verified and cannot be guaranteed by SCM, (iv) should not be reproduced or disclosed to any other person, without SCM’s prior consent and (v) is not intended for distribution in any jurisdiction in which its distribution would be prohibited.
In connection with this material, SCM (i) makes no representation or warranties as to the appropriateness or reliance for use in any transaction or as to the permissibility or legality of any financial instrument in any jurisdiction, (ii) believes the information in this material to be reliable, has not independently verified such information and makes no representation, express or implied, with regard to the accuracy or completeness of such information, (iii) accepts no responsibility or liability as to any reliance placed, or investment decision made, on the basis of such information by the recipient and (iv) does not undertake, and disclaims any duty to undertake, to update or to revise the information contained in this material.
Unless otherwise stated, the views, opinions, forecasts, valuations, or estimates contained in this material are those solely of the author, as of the date of publication of this material, and are subject to change without notice. The recipient of this material should make an independent evaluation of this information and make such other investigations as the recipient considers necessary (including obtaining independent financial advice), before transacting in any financial market or instrument discussed in or related to this material.
Important disclaimers for clients in the EU and UK
This publication has been prepared by Trading Desk Strategists within the Sales and Trading functions of Santander US Capital Markets LLC (“SanCap”), the US registered broker-dealer of Santander Corporate & Investment Banking. This communication is distributed in the EEA by Banco Santander S.A., a credit institution registered in Spain and authorised and regulated by the Bank of Spain and the CNMV. Any EEA recipient of this communication that would like to affect any transaction in any security or issuer discussed herein should do so with Banco Santander S.A. or any of its affiliates (together “Santander”). This communication has been distributed in the UK by Banco Santander, S.A.’s London branch, authorised by the Bank of Spain and subject to regulatory oversight on certain matters by the Financial Conduct Authority (FCA) and the Prudential Regulation Authority (PRA).
The publication is intended for exclusive use for Professional Clients and Eligible Counterparties as defined by MiFID II and is not intended for use by retail customers or for any persons or entities in any jurisdictions or country where such distribution or use would be contrary to local law or regulation.
This material is not a product of Santander´s Research Team and does not constitute independent investment research. This is a marketing communication and may contain ¨investment recommendations¨ as defined by the Market Abuse Regulation 596/2014 ("MAR"). This publication has not been prepared in accordance with legal requirements designed to promote the independence of research and is not subject to any prohibition on dealing ahead of the dissemination of investment research. The author, date and time of the production of this publication are as indicated herein.
This publication does not constitute investment advice and may not be relied upon to form an investment decision, nor should it be construed as any offer to sell or issue or invitation to purchase, acquire or subscribe for any instruments referred herein. The publication has been prepared in good faith and based on information Santander considers reliable as of the date of publication, but Santander does not guarantee or represent, express or implied, that such information is accurate or complete. All estimates, forecasts and opinions are current as at the date of this publication and are subject to change without notice. Unless otherwise indicated, Santander does not intend to update this publication. The views and commentary in this publication may not be objective or independent of the interests of the Trading and Sales functions of Santander, who may be active participants in the markets, investments or strategies referred to herein and/or may receive compensation from investment banking and non-investment banking services from entities mentioned herein. Santander may trade as principal, make a market or hold positions in instruments (or related derivatives) and/or hold financial interest in entities discussed herein. Santander may provide market commentary or trading strategies to other clients or engage in transactions which may differ from views expressed herein. Santander may have acted upon the contents of this publication prior to you having received it.
This publication is intended for the exclusive use of the recipient and must not be reproduced, redistributed or transmitted, in whole or in part, without Santander’s consent. The recipient agrees to keep confidential at all times information contained herein.


