


Uncategorized
WACy speeds lead the pack
admin | April 5, 2019
This document is intended for institutional investors and is not subject to all of the independence and disclosure standards applicable to debt research reports prepared for retail investors. This material does not constitute research.
Lower rates, additional business days, and a seasonal rise in housing turnover combined to push average agency MBS prepayment speeds more than 20% faster in March. And right at the front of the race came recently issued pools with unusually high weighted average coupons, or gross WACs, sprinting past pools of similar age but lower gross WAC. New pools with elevated gross WACs should go away in June once recently announced rules for pooling start to apply. But the existing high WAC pools look likely to continue affecting TBA pricing.
High gross WAC pools are prepaying quickly
A major concern in the market is the recent production of high gross WAC pools, which has continued into March. The March Fannie 3.5% pools, for example, have a gross WAC of 4.52%, almost 20 bp higher than production in November 2018, the most recent month of production with normal gross WACs.
The recent drop in rates is already triggering adverse prepayment speeds. The 3.5% Fannie Mae pools issued in January have a gross WAC of 4.63% and reached 5.1 CPR in March, for example, while the November 2018 production has a gross WAC of 4.36% and only prepaid at 3.7 CPR. The January 4.0% pools with a gross WAC of 4.94% prepaid at 7.5 CPR, as another example, compared to the lower gross WAC November pools at 6.7 CPR.
Overall Fannie Mae 30-year MBS prepaid 26% faster and Freddie Mac prepaid 24% faster, both in line with expectations of a 20% to 25% increase. Ginnie Mae II MBS prepaid similarly, jumping 23%.
Production should improve in June
The Federal Housing Finance Agency and the GSEs recently announced changes to pooling policies aimed at controlling the gross-WAC-to-net-coupon spread. The changes reduce the ability of originators to deliver loans into a broad range of coupons. The rule takes effect in June and consists of two parts:
- The maximum spread between the note rate of a loan and the coupon of the pool cannot exceed 112.5 bp, down from 250 bp today (except for Freddie Mac multi lender swap pools, which were already lower), and
- The retained servicing cannot exceed 50 bp. The minimum servicing of 25 bp remains unchanged.
The spread between the loan’s note rate and the pool’s coupon is split between the GSE and the servicer. Since the servicer will no longer be permitted to retain more than 50 bp of servicing, and the remainder must be paid to the GSE as a guarantee fee. The base guarantee fee averages 40 bp, and the lender has the ability to buy up the guarantee fee—receive cash from the GSE upfront in exchange for paying a higher ongoing guarantee fee—by as much as 25 bp. If the lender pools a note with a rate 112.5 bp above the coupon, the rules leave enough room for the servicer to retain 47.5 bp of servicing (112.5 – (40 + 25) = 47.5).
A major reason a lender might choose to buy up the guarantee fee is to help cover any loan-level price adjustments, or LLPAs. When a lender delivers a loan to the GSE, the lender has to pay the LLPAs upfront. This cost is passed on to the borrower in the form of a higher rate. The lender can buy up the guarantee fee—receive cash from the GSE upfront in exchange for paying a higher ongoing guarantee fee. This effectively rolls the LLPAs into the guarantee fee.
The benefit of the cap is apparent on low LLPA loans. Consider a 5.125% loan that pays no LLPAs and has a 40 bp base guarantee fee. Under today’s rules the lender could deliver that loan into a 4.0% pool and retain 72.5 bp of servicing. Under the new rules the lender can only deliver into a 4.0% pool by retaining 50 bp of servicing and buying up the guarantee fee an additional 22.5 bp. But the lender could also retain the same 50 bp of servicing and deliver into the 4.5% pool; in order to do this the guarantee fee would need to be bought down to 12.5 bp. Best execution will depend heavily on the buy-up/buy-down grids, and it seems likely the grids will steer lenders towards the higher coupon pool.
Pools issued under these rules should prepay better
The changes mean that new pools should have a lower spread between the gross WAC and pool coupon. Furthermore, the higher spread loans are more likely to have higher LLPAs. This is important for prepayment behavior, since the borrower will likely have to pay the same LLPA when refinancing. Therefore the LLPA acts as an elbow shift that offset loan’s apparent higher WAC, since those borrowers would refinance into a higher WAC loan.
Recent production gross WACs would have been lower
Applying these rules to recent production pools demonstrates that spreads should fall once the new policy is effective in June. The 112.5 bp cap is simpler to check against, but turns out to have limited effect on its own. There aren’t enough loans issued with spreads above 112.5 bp.
Estimating the effect of the cap on servicing is more difficult, since the overall guarantee fee isn’t disclosed. However it can be done subject to a few assumptions:
- The base guarantee fee is 40 bp, roughly as reported by the FHFA.
- The LLPA is calculated for each loan and converted into a running rate.
- The lender is assumed to have bought up the guarantee fee by as much as 25 bp to offset LLPAs.
- The remaining spread is servicing.
- The new pool coupon is the lowest coupon that satisfies retained servicing less than or equal to 50 bp and total spread less than or equal to 112.5 bp.
Exhibit 1: Capping excess servicing would have lowered gross WACs
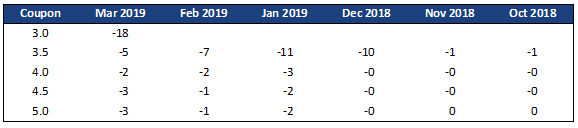
Note: Estimated impact on gross WAC of applying new pooling rules to recent Fannie Mae 30-year production. Source: Fannie Mae, eMBS, Amherst Pierpont Securities.
December 2018 was the first month with lots of high gross WAC production, in particular in 3.5% pools. The new pooling restrictions would have lowered gross WACs by 10 bp in December and 11 bp in January. Gross WACs on the 3.0% pools issued in March would have fallen by 18 bp. There is a smaller effect on higher coupons, but the gross WACs on those pools hadn’t widened as much.
New pools with lower gross WACs could command a pay-up over TBA, which could be polluted by the presence of these high gross WAC pools. An originator might capitalize on this by pooling lower gross WAC loans, possibly those with low guarantee fees, into single issuer spec pools. The remaining loans could be placed in the major pools. This could hurt the major pools unless those loans tend to have high LLPAs.
The Fannie Mae and Freddie Mac numbers
Both GSEs pools prepaid faster in March, in-line with expectations of a 20% to 25% increase. Fannie Mae pools prepaid 25.7% to 9.0 CPR from 7.2 CPR faster and Freddie Mac pools prepaid 24.1% to 8.8 CPR from 7.1 CPR faster. Lower driving rates, increased day count, and stronger seasonal turnover all pushed speeds faster. The largest increases came on lower coupon and pools on the edge of refinancing, while seasoned premiums, especially at Fannie Mae, were more muted.
Exhibit 2: The rally pushes speeds faster
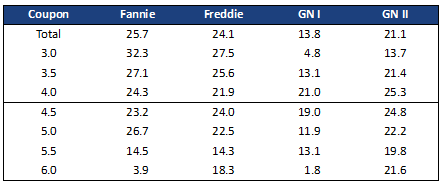
Note: % change in 30-year prepayment speeds from February 2019 to March 2019. Source: Fannie Mae, Freddie Mac, Ginnie Mae, eMBS, 1010data, Amherst Pierpont Securities.
Ginnie Mae
Ginnie Mae II speeds increased similarly to conventionals, jumping 22.8% to 11.9 CPR from 9.8 CPR. Ginnie Is were slower overall, but most of these pools are seasoned and are quite burnt out.
Looking ahead
Prepayment speeds should increase roughly 10% in April. Lagged mortgage rates fall 13 bp but day count is flat and seasonal turnover doesn’t increase much over March. The big month should be May, as driving rates fall another 17 bp, there is an additional collection day, and turnover picks up as the school year ends in many parts of the country.
Data Tables
Exhibit 3: Prepayment summary
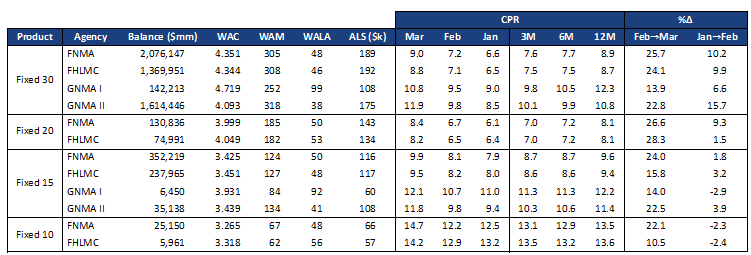
Source: Fannie Mae, Freddie Mac, Ginnie Mae, eMBS, Amherst Pierpont Securities.
Our short term forecast is shown in Exhibit 6 (Fannie Mae) and Exhibit 7 (Freddie Mac). Exhibit 5 shows the static rates used in the prepayment forecast.
Exhibit 4: Agency speeds, largest cohorts
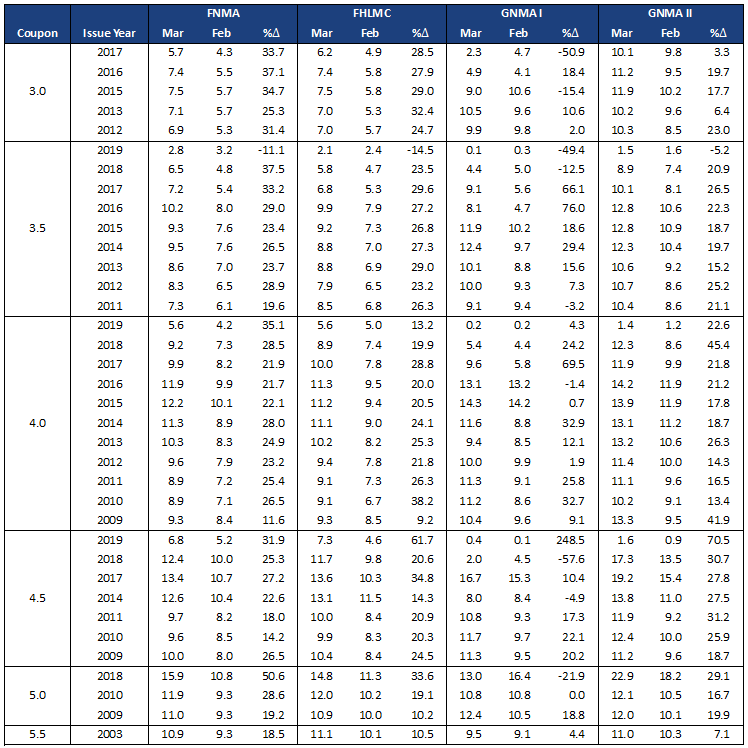
Source: Fannie Mae, Freddie Mac, Ginnie Mae, eMBS, 1010data, Amherst Pierpont Securities.
Exhibit 5: Mortgage rate forecast
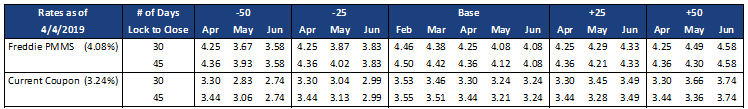
Source: Freddie Mac, Bloomberg, Amherst Pierpont Securities.
Exhibit 6: Fannie Mae short term forecast
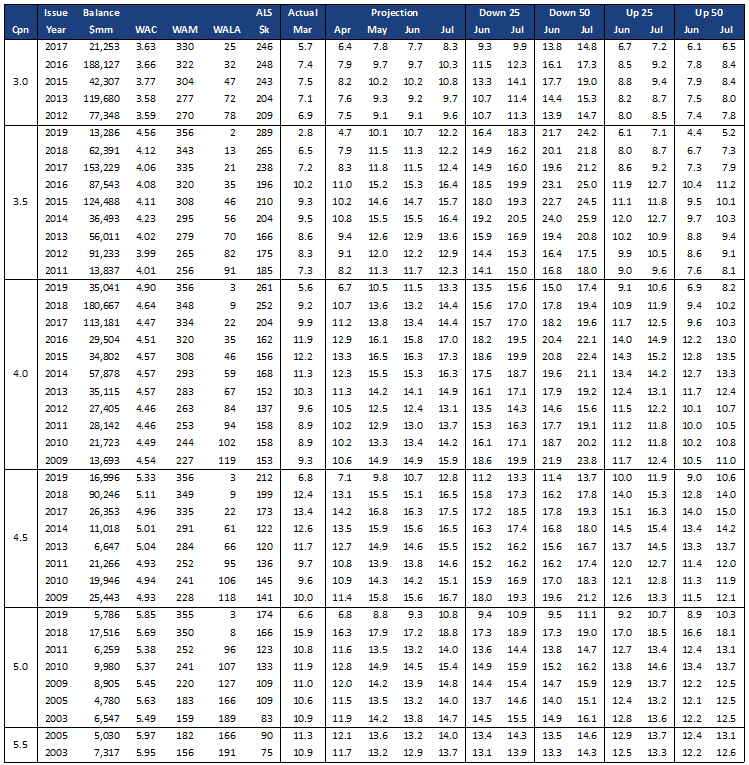
Source: Fannie Mae, eMBS, 1010data, Amherst Pierpont Securities.
Exhibit 7: Freddie Mac short term forecast
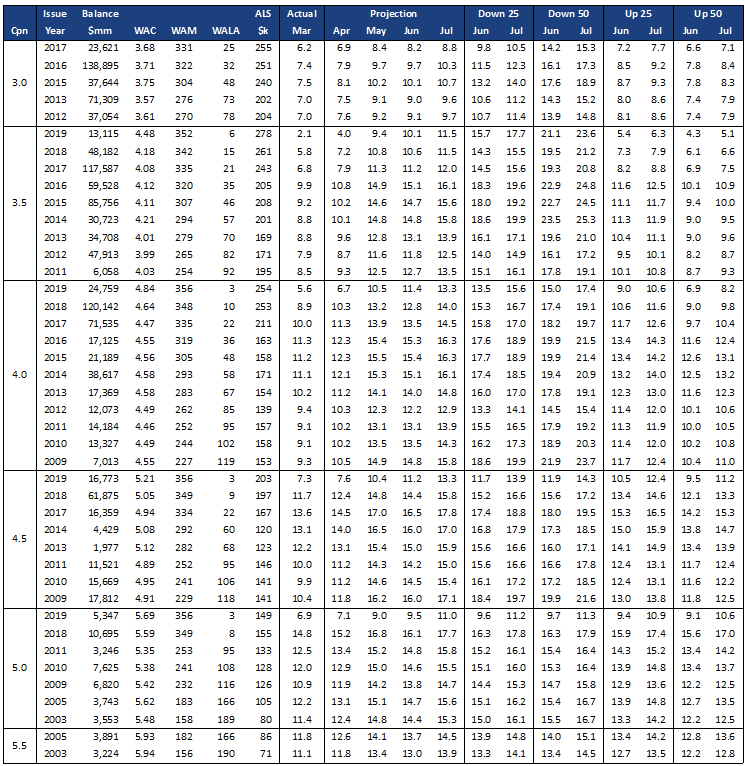
Source: Freddie Mac, eMBS, 1010data, Amherst Pierpont Securities