Uncategorized
The quiet tide behind tighter spreads
admin | April 5, 2019
This material is a Marketing Communication and does not constitute Independent Investment Research.
Something besides the Fed and the usual fundamentals quietly seems to be helping tighten spreads to the Treasury curve across key parts of fixed income: US deficit spending. Deficits and the surge of Treasury debt needed to fund them often leave yield spreads to swaps, corporate debt and MBS tighter; surpluses often leave Treasuries scarce and spreads wider. With the Congressional Budget Office projecting outstanding Treasury debt will rise as percent of GDP by 1.3% a year for the next decade, the tide is rolling toward tighter spreads.
Rising Treasury supply tends to tighten spreads
US public debt as a share of GDP has long affected the yield spread between Treasury debt and other parts of fixed income (Exhibit 1). As debt share rose from 55% of GDP before the 1991 recession toward 65% afterwards, for instance, spreads on 10-year swaps tightened from 80 bp to 40 bp. As falling deficits and eventual budget surpluses drove share back toward 55% in 2000, 10-year swap spreads widened to more than 120 bp. Deficits and rising debt share after the 2001 recession had no visible impact on spreads. But heavy deficit spending and the jump in debt share from 65% in 2008 to 104% today has coincided with a collapse in 10-year swap spreads toward zero.
Exhibit 1: Treasury debt as a share of GDP has shaped spread markets
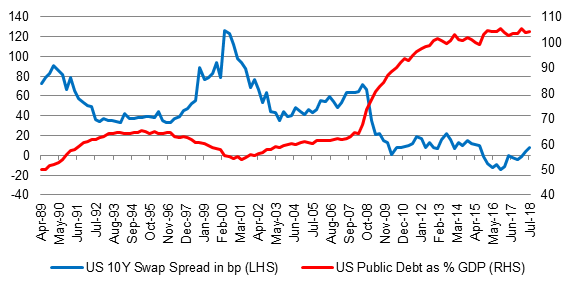
Source: Federal Reserve, Bloomberg, Amherst Pierpont Securities.
A structural model of 10-year swap spreads using only public Treasury debt as a share of GDP highlights the broad link between debt share and spread markets (Exhibit 2). Debt share alone misses the peaks and valleys in swap spreads, so other factors are clearly at work. The slope of the yield curve has mattered, with steeper curves associated with tighter spreads and flatter curves with wider spreads. Financing rates on Treasury debt have mattered, too, with special financing and the improving carry in Treasury debt forcing yields on competing investments wider. Volatility, liquidity premiums and indicators for MBS delta-hedging also figure in various spread models. But debt share is a core structural element of the difference between Treasury yields and yields in other parts of fixed income.
Exhibit 2: A swap spread model with only Treasury supply captures broad trends
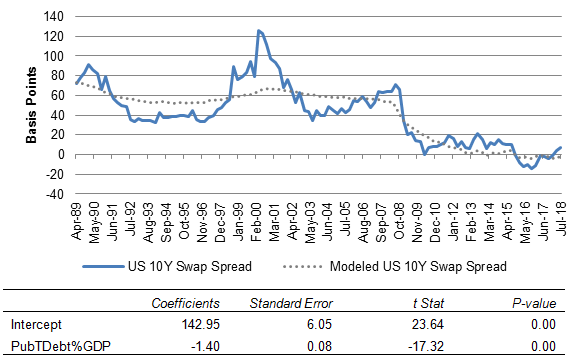
Note: R-squared of 0.72 based on 118 quarterly observations from 1Q1989 to 2Q2017. Source: Amherst Piepont Securities.
Since mid-2018, after the magnitude of likely US deficits started becoming clearer, swap spreads have generally tightened and MBS has performed better against the Treasury than the swap curve (Exhibit 3).
Exhibit 3: With US deficits clearer since early 2018, MBS has held spread better against Treasury than the swaps curve
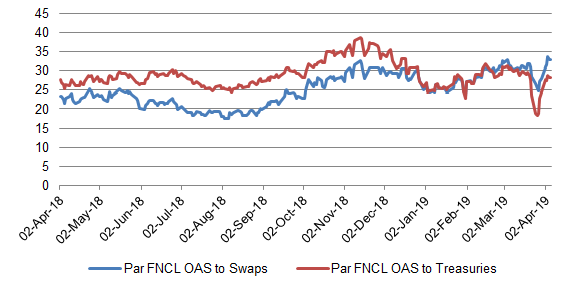
Source: Amherst Pierpont Securities.
The Congressional Budget Office in January projected that federal debt held by the public would grow from 78% of GDP at the end of 2019 to 93% by the end of 2029—1.3% a year for the next decade. If history holds, swap spreads and spreads in other sectors would grind tighter by 1.8 bp a year or nearly 20 bp in total. The tide toward tighter spreads is rolling.
* * *
The view in rates
Rates look rich, especially in the belly of the Treasury curve. The 5-year real rate of 0.48%, which arguably implies growth around 1.0%, looks too low. Breakeven inflation of 182 bp also looks a little light. Growth rather than inflation looks most likely to surprise the market. The market may need to see several quarters of steady rather than declining growth to buy the consensus among economists that growth will plateau around 2.0%, but that looks very likely to happen. Fair value on 5- and 10-year notes is somewhere above 2.75%. Look for rates to rise faster on 5- than on 10-year notes.
The 2.34% rate on 2-year notes has built in slightly more than one Fed rate cut in the next two years. That seems to anticipate a Fed willing to defend growth. That seems realistic. The Fed could easily cut if growth shows any sign of slowing below 2.0%.
The view in spreads
Relatively low volatility and heavy net Treasury supply should help spread products tighten. The corporate market still has issues with leverage in investment grade debt and loose underwriting in leveraged loans; a slowing economy should put pressure on those sectors. But corporate management is starting to deleverage. Still, credit concerns linger. Agency MBS should broadly outperform corporate debt.
The view in credit fundamentals
Companies have started to divert cash flow toward paying down debt, have started to sell non-core assets and have curtailed stock buybacks. Management has heard the concerns of debt investors. Households continue to look strong with low unemployment, rising home prices, and generally good performance in investment portfolios.
This material is intended only for institutional investors and does not carry all of the independence and disclosure standards of retail debt research reports. In the preparation of this material, the author may have consulted or otherwise discussed the matters referenced herein with one or more of SCM’s trading desks, any of which may have accumulated or otherwise taken a position, long or short, in any of the financial instruments discussed in or related to this material. Further, SCM may act as a market maker or principal dealer and may have proprietary interests that differ or conflict with the recipient hereof, in connection with any financial instrument discussed in or related to this material.
This message, including any attachments or links contained herein, is subject to important disclaimers, conditions, and disclosures regarding Electronic Communications, which you can find at https://portfolio-strategy.apsec.com/sancap-disclaimers-and-disclosures.
Important Disclaimers
Copyright © 2026 Santander US Capital Markets LLC and its affiliates (“SCM”). All rights reserved. SCM is a member of FINRA and SIPC. This material is intended for limited distribution to institutions only and is not publicly available. Any unauthorized use or disclosure is prohibited.
In making this material available, SCM (i) is not providing any advice to the recipient, including, without limitation, any advice as to investment, legal, accounting, tax and financial matters, (ii) is not acting as an advisor or fiduciary in respect of the recipient, (iii) is not making any predictions or projections and (iv) intends that any recipient to which SCM has provided this material is an “institutional investor” (as defined under applicable law and regulation, including FINRA Rule 4512 and that this material will not be disseminated, in whole or part, to any third party by the recipient.
The author of this material is an economist, desk strategist or trader. In the preparation of this material, the author may have consulted or otherwise discussed the matters referenced herein with one or more of SCM’s trading desks, any of which may have accumulated or otherwise taken a position, long or short, in any of the financial instruments discussed in or related to this material. Further, SCM or any of its affiliates may act as a market maker or principal dealer and may have proprietary interests that differ or conflict with the recipient hereof, in connection with any financial instrument discussed in or related to this material.
This material (i) has been prepared for information purposes only and does not constitute a solicitation or an offer to buy or sell any securities, related investments or other financial instruments, (ii) is neither research, a “research report” as commonly understood under the securities laws and regulations promulgated thereunder nor the product of a research department, (iii) or parts thereof may have been obtained from various sources, the reliability of which has not been verified and cannot be guaranteed by SCM, (iv) should not be reproduced or disclosed to any other person, without SCM’s prior consent and (v) is not intended for distribution in any jurisdiction in which its distribution would be prohibited.
In connection with this material, SCM (i) makes no representation or warranties as to the appropriateness or reliance for use in any transaction or as to the permissibility or legality of any financial instrument in any jurisdiction, (ii) believes the information in this material to be reliable, has not independently verified such information and makes no representation, express or implied, with regard to the accuracy or completeness of such information, (iii) accepts no responsibility or liability as to any reliance placed, or investment decision made, on the basis of such information by the recipient and (iv) does not undertake, and disclaims any duty to undertake, to update or to revise the information contained in this material.
Unless otherwise stated, the views, opinions, forecasts, valuations, or estimates contained in this material are those solely of the author, as of the date of publication of this material, and are subject to change without notice. The recipient of this material should make an independent evaluation of this information and make such other investigations as the recipient considers necessary (including obtaining independent financial advice), before transacting in any financial market or instrument discussed in or related to this material.
Important disclaimers for clients in the EU and UK
This publication has been prepared by Trading Desk Strategists within the Sales and Trading functions of Santander US Capital Markets LLC (“SanCap”), the US registered broker-dealer of Santander Corporate & Investment Banking. This communication is distributed in the EEA by Banco Santander S.A., a credit institution registered in Spain and authorised and regulated by the Bank of Spain and the CNMV. Any EEA recipient of this communication that would like to affect any transaction in any security or issuer discussed herein should do so with Banco Santander S.A. or any of its affiliates (together “Santander”). This communication has been distributed in the UK by Banco Santander, S.A.’s London branch, authorised by the Bank of Spain and subject to regulatory oversight on certain matters by the Financial Conduct Authority (FCA) and the Prudential Regulation Authority (PRA).
The publication is intended for exclusive use for Professional Clients and Eligible Counterparties as defined by MiFID II and is not intended for use by retail customers or for any persons or entities in any jurisdictions or country where such distribution or use would be contrary to local law or regulation.
This material is not a product of Santander´s Research Team and does not constitute independent investment research. This is a marketing communication and may contain ¨investment recommendations¨ as defined by the Market Abuse Regulation 596/2014 ("MAR"). This publication has not been prepared in accordance with legal requirements designed to promote the independence of research and is not subject to any prohibition on dealing ahead of the dissemination of investment research. The author, date and time of the production of this publication are as indicated herein.
This publication does not constitute investment advice and may not be relied upon to form an investment decision, nor should it be construed as any offer to sell or issue or invitation to purchase, acquire or subscribe for any instruments referred herein. The publication has been prepared in good faith and based on information Santander considers reliable as of the date of publication, but Santander does not guarantee or represent, express or implied, that such information is accurate or complete. All estimates, forecasts and opinions are current as at the date of this publication and are subject to change without notice. Unless otherwise indicated, Santander does not intend to update this publication. The views and commentary in this publication may not be objective or independent of the interests of the Trading and Sales functions of Santander, who may be active participants in the markets, investments or strategies referred to herein and/or may receive compensation from investment banking and non-investment banking services from entities mentioned herein. Santander may trade as principal, make a market or hold positions in instruments (or related derivatives) and/or hold financial interest in entities discussed herein. Santander may provide market commentary or trading strategies to other clients or engage in transactions which may differ from views expressed herein. Santander may have acted upon the contents of this publication prior to you having received it.
This publication is intended for the exclusive use of the recipient and must not be reproduced, redistributed or transmitted, in whole or in part, without Santander’s consent. The recipient agrees to keep confidential at all times information contained herein.


