Uncategorized
Positioning in rates for signs of growth
admin | April 4, 2019
This material is a Marketing Communication and does not constitute Independent Investment Research.
Investors should consider putting on 5s30s Treasury curve flatteners, which are positive carry and likely to profit as the economy trends towards slower but solid growth over the next two quarters. The 5s30s slope is close to the high end of its 1-year range, and market conviction that the Fed will cut rates to defend growth is unlikely to erode. This will likely keep the 2-year note pinned below the Fed funds target, while an improving economic outlook should lift rates from the belly through the long end, flattening the curve.
Slower but steady growth
The US economy is migrating to a slower growth regime – a trend that has long been projected – but one that is far from the doom and gloom perspective currently reflected in the Treasury curve. Since late 2018 the rates market has gradually priced in an increasingly pessimistic scenario for economic growth, and more recently for a Fed that will respond to that weakness by easing monetary policy to defend growth. The next two quarters of 2019 should bring stability to the previous shut-down impacted economic data, reinforce the trend of moderate but stable GDP growth, and ease fears of a near-term recession. Amherst Pierpont Chief Economist Stephen Stanley projects 2019 GDP growth of 2.8% (Q4/Q4) versus market consensus of 2.1%.
No carry being long Treasuries
Being long Treasuries in the current environment requires stoicism. General collateral overnight repo rates remain elevated at 2.53%, thanks to some lingering distortion in the funding markets over quarter-end. That makes daily and 6-month projected carry flat to negative across the curve, with the exception of 30-year notes, which are positive on a dollar basis, but it barely amounts to a basis point once normalized for the increased duration risk (Exhibit 1).
Exhibit 1: Treasury carry and rolldown across the curve
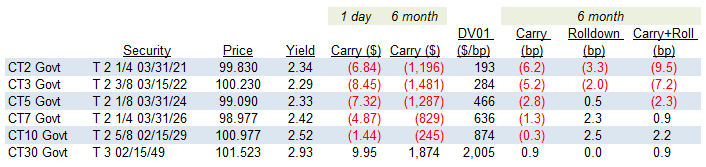
Note: All carry and dollar value of a basis point (DV01) calculations assume $1 million face of the bond. An overnight general collateral repo rate of 2.53% is used for all bonds, which ignores special financing which can temporarily improve carry. The 6-month period ends 10/7/2019 which is 185 calendar days. All calculations as of 4/4/2019. Source: Bloomberg, Amherst Pierpont Securities.
Rolldown isn’t helping. The inversion in the front end means 2-year and 3-year notes are rolling up the curve, adding to the pain of being long. The modest projected rolldown in the 5- to 10-year securities is barely enough to offset the negative carry, and the 30-year sector of the curve remains so flat that over short time horizons it neither meaningfully hurts or helps long positions.
The fed funds target and the 30-year bond anchor the curve
Despite exhortations from the President, the FOMC seems broadly comfortable keeping the fed funds rate at its current 2.25 to 2.50% target range barring a meaningful and persistent shift in either inflation or unemployment. Lowering the target rate purely as a mechanism to defend growth lies outside the Congressionally established mandate of the Federal Reserve for the conduct of monetary policy. Doing so would seriously damage the Fed’s credibility as an independent body and potentially lead to the development of asset price bubbles. The market remains skeptical of the Fed’s resolve and the strength of the economy, pushing 2-year notes below the target rate in early March. History suggests this inversion will persist until the Fed does next cut rates, whether that cut is two months or 14 months into the future (Exhibit 2).
Exhibit 2: Inversion in fed funds vs 2-year Treasury prior to easing cycles
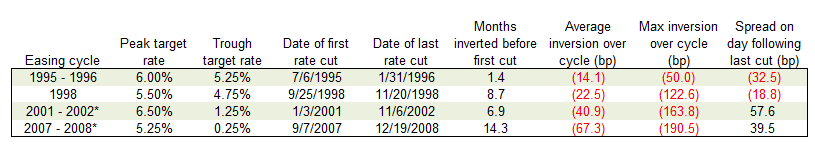
Source: Amherst Pierpont Securities
The 30-year bond yield is historically the least volatile point on the curve, and a low growth, low inflation environment will almost certainly reinforce that. The most volatile point on the curve has long been the 5-year Treasury, which is often said to lead the curve higher or lower – selling off the most when yields are rising, and conversely rallying the most when yields fall. The economic data over the next two quarters should be consistent with steady but slower growth and low inflation, pushing recession fears into the distance. The 5-year Treasury should lead rates modestly higher, flattening the long-end, while the inversion in the very front end of the curve remains sticky.
Treasury flatteners are positive carry
When the Treasury yield curve is flat to inverted, curve flattening trades can become positive carry and curve steepening trades conversely become negative carry (Exhibit 3). Overnight financing rates are currently hovering above the 2.50% target rate, thanks mostly to distortions over quarter-end that have yet to fully resolve. Assuming general collateral Treasury repo returns to the mid to high 2.40s these curve flatteners will remain positive carry.
Exhibit 3: Treasury curve flatteners
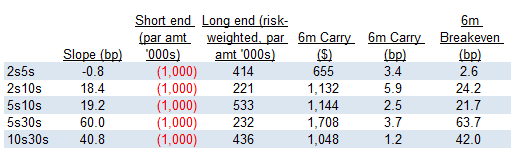
Note: General collateral repo of 2.53% used for all bonds, ignoring special repo rates for on-the-run Treasuries; 6-month carry to 10/7/2019 or 186 days. Flatteners are constructed duration-neutral. Source: Bloomberg, Amherst Pierpont Securities
The 5s30s slope is currently +60 bp, near the top of its 1-year range. The 5s30s flattener has a modestly positive carry of 3.7 bp over the next six months, giving the trade a breakeven spread of 63.7 bp. An easing of recession fears should flatten 5s30s back to the neighborhood of 40 bp, where it hovered for much of the fourth quarter of 2018, for a projected profit of 23.7 bp, or $11,031 per $1 million face of the 5-year.
A sell-off in the 5-year will pull the 2-year up with it, but it’s unlikely that 2s will develop enough momentum to break through the target rate. This will mechanically steepen 2s5s, but it’s a difficult trade to recommend given the negative carry and modest potential upside.
This material is intended only for institutional investors and does not carry all of the independence and disclosure standards of retail debt research reports. In the preparation of this material, the author may have consulted or otherwise discussed the matters referenced herein with one or more of SCM’s trading desks, any of which may have accumulated or otherwise taken a position, long or short, in any of the financial instruments discussed in or related to this material. Further, SCM may act as a market maker or principal dealer and may have proprietary interests that differ or conflict with the recipient hereof, in connection with any financial instrument discussed in or related to this material.
This message, including any attachments or links contained herein, is subject to important disclaimers, conditions, and disclosures regarding Electronic Communications, which you can find at https://portfolio-strategy.apsec.com/sancap-disclaimers-and-disclosures.
Important Disclaimers
Copyright © 2026 Santander US Capital Markets LLC and its affiliates (“SCM”). All rights reserved. SCM is a member of FINRA and SIPC. This material is intended for limited distribution to institutions only and is not publicly available. Any unauthorized use or disclosure is prohibited.
In making this material available, SCM (i) is not providing any advice to the recipient, including, without limitation, any advice as to investment, legal, accounting, tax and financial matters, (ii) is not acting as an advisor or fiduciary in respect of the recipient, (iii) is not making any predictions or projections and (iv) intends that any recipient to which SCM has provided this material is an “institutional investor” (as defined under applicable law and regulation, including FINRA Rule 4512 and that this material will not be disseminated, in whole or part, to any third party by the recipient.
The author of this material is an economist, desk strategist or trader. In the preparation of this material, the author may have consulted or otherwise discussed the matters referenced herein with one or more of SCM’s trading desks, any of which may have accumulated or otherwise taken a position, long or short, in any of the financial instruments discussed in or related to this material. Further, SCM or any of its affiliates may act as a market maker or principal dealer and may have proprietary interests that differ or conflict with the recipient hereof, in connection with any financial instrument discussed in or related to this material.
This material (i) has been prepared for information purposes only and does not constitute a solicitation or an offer to buy or sell any securities, related investments or other financial instruments, (ii) is neither research, a “research report” as commonly understood under the securities laws and regulations promulgated thereunder nor the product of a research department, (iii) or parts thereof may have been obtained from various sources, the reliability of which has not been verified and cannot be guaranteed by SCM, (iv) should not be reproduced or disclosed to any other person, without SCM’s prior consent and (v) is not intended for distribution in any jurisdiction in which its distribution would be prohibited.
In connection with this material, SCM (i) makes no representation or warranties as to the appropriateness or reliance for use in any transaction or as to the permissibility or legality of any financial instrument in any jurisdiction, (ii) believes the information in this material to be reliable, has not independently verified such information and makes no representation, express or implied, with regard to the accuracy or completeness of such information, (iii) accepts no responsibility or liability as to any reliance placed, or investment decision made, on the basis of such information by the recipient and (iv) does not undertake, and disclaims any duty to undertake, to update or to revise the information contained in this material.
Unless otherwise stated, the views, opinions, forecasts, valuations, or estimates contained in this material are those solely of the author, as of the date of publication of this material, and are subject to change without notice. The recipient of this material should make an independent evaluation of this information and make such other investigations as the recipient considers necessary (including obtaining independent financial advice), before transacting in any financial market or instrument discussed in or related to this material.
Important disclaimers for clients in the EU and UK
This publication has been prepared by Trading Desk Strategists within the Sales and Trading functions of Santander US Capital Markets LLC (“SanCap”), the US registered broker-dealer of Santander Corporate & Investment Banking. This communication is distributed in the EEA by Banco Santander S.A., a credit institution registered in Spain and authorised and regulated by the Bank of Spain and the CNMV. Any EEA recipient of this communication that would like to affect any transaction in any security or issuer discussed herein should do so with Banco Santander S.A. or any of its affiliates (together “Santander”). This communication has been distributed in the UK by Banco Santander, S.A.’s London branch, authorised by the Bank of Spain and subject to regulatory oversight on certain matters by the Financial Conduct Authority (FCA) and the Prudential Regulation Authority (PRA).
The publication is intended for exclusive use for Professional Clients and Eligible Counterparties as defined by MiFID II and is not intended for use by retail customers or for any persons or entities in any jurisdictions or country where such distribution or use would be contrary to local law or regulation.
This material is not a product of Santander´s Research Team and does not constitute independent investment research. This is a marketing communication and may contain ¨investment recommendations¨ as defined by the Market Abuse Regulation 596/2014 ("MAR"). This publication has not been prepared in accordance with legal requirements designed to promote the independence of research and is not subject to any prohibition on dealing ahead of the dissemination of investment research. The author, date and time of the production of this publication are as indicated herein.
This publication does not constitute investment advice and may not be relied upon to form an investment decision, nor should it be construed as any offer to sell or issue or invitation to purchase, acquire or subscribe for any instruments referred herein. The publication has been prepared in good faith and based on information Santander considers reliable as of the date of publication, but Santander does not guarantee or represent, express or implied, that such information is accurate or complete. All estimates, forecasts and opinions are current as at the date of this publication and are subject to change without notice. Unless otherwise indicated, Santander does not intend to update this publication. The views and commentary in this publication may not be objective or independent of the interests of the Trading and Sales functions of Santander, who may be active participants in the markets, investments or strategies referred to herein and/or may receive compensation from investment banking and non-investment banking services from entities mentioned herein. Santander may trade as principal, make a market or hold positions in instruments (or related derivatives) and/or hold financial interest in entities discussed herein. Santander may provide market commentary or trading strategies to other clients or engage in transactions which may differ from views expressed herein. Santander may have acted upon the contents of this publication prior to you having received it.
This publication is intended for the exclusive use of the recipient and must not be reproduced, redistributed or transmitted, in whole or in part, without Santander’s consent. The recipient agrees to keep confidential at all times information contained herein.


