Uncategorized
The 2-year note has a view on the Fed’s next move
admin | March 29, 2019
This material is a Marketing Communication and does not constitute Independent Investment Research.
All four times since 1994 that the yield on the 2-year Treasury note has dropped below the fed funds target rate, the Fed has cut the target within 18 months. And without that inversion, the modern Fed has never cut. With the 2-year yield now nearly 25 bp below the funds target, the market has shown its conviction on the Fed’s next move.
It’s no surprise that the Treasury curve constantly tries to anticipate the Fed, but the track record of the 2-year note is, well, notable. Ever since the Fed first announced a target rate in 1994, inversion between the target and 2-year yields has predicted every cycle of cuts (Exhibit 1). Investors in 2-year notes, after all, have to weigh the alternative of a rolling investment in Treasury bills or similar short instruments heavily influenced by the Fed’s path. The 2-year note should constantly price to at least break even against the expected funds.
Exhibit 1: Seeing 2-year yields below fed funds has signaled all cuts since 1994
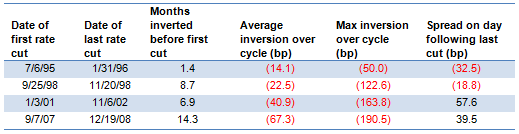
Source: Amherst Pierpont Securities
The aftermath of seeing 2-year yields drop below the target has not always been the same, however. Starting from the 1995-1996 cycle of cuts, the time the market had to wait between the first inversion and the first cut has generally lengthened. The average and maximum inversion during the subsequent cycle has deepened. And the market arguably has improved its ability to anticipate the last cut.
Starting with the 1995-1996 easing cycle, the funds-to-2-year inversion came less than two months before the first cut. In 1998, the inversion came nearly nine months before the first cut. Inversion came nearly seven months before the first cut of 2001-2002. And the 2007-2008 easing cycle saw inversion more than 14 months before the first cut.
Once the funds-to-2-year rate inverts, it tends to stay inverted through the easing cycle. Inversion during 1995-1996 averaged 14 bp with a maximum of 50 bp. The average rose in 1998 to 22 bp with a maximum of 123 bp. The average rose again in 2001-2002 to 41 bp with a maximum of 164 bp. And the average peaked in 2007-2008 at 67 bp with a maximum of 190 bp.
The market also seems to have improved its ability to anticipate the end of an easing cycle. In the 1995-1996 and 1998 cycles, 2-year yields still stood below the fed funds target the day after the last cut. But by the 2001-2002 and 2007-2008 cycles, 2-year yields had jumped above target funds by the time of the last cut.
Other work has highlighted inversion in short rates rather than long rates as a predictor of market events. The NY Fed recently noted the strength of the inversion between the current 3-month Treasury bill and the implied rate on bills 18-months forward as a predictor of recession. The inversion between target fed funds and 2-year yields may have some information about implied recession, but it likely says more about the Fed’s policy aspiration to ward off recession. That’s likely a more accurate read on what the current inversion implies.
***
The view in rates
The market continues to revise down its expectations for US growth, and recently, inflation, and it all rolls up into the current 2.40% 10-year rate. The 10-year real rate of 0.53%, which arguably implies growth around 1.0%, looks too low. Breakeven inflation of 187 bp also looks a little light. The market may need to see several quarters of steady rather than declining growth to buy the consensus among economists that growth will plateau around 2.0%, but that looks very likely to happen. Fair value on 10-year notes is somewhere above 2.75%. Look for longer rates to rise from here.
The 2.26% rate on 2-year notes has has built in at least two Fed rate cuts in the next two years. That seems more of a growth than a recession concern. The Fed could easily cut if growth shows any sign of slowing below 2.0%.
With the yield curve flat between 2- and 7-year maturities and upwardly sloped beyond, investors will have to pick their yield curve spots carefully, especially when it comes to hedging.
The view in spreads
In general, low volatility and heavy net Treasury supply should help spread products tighten. The corporate market still has issues with leverage in investment grade debt and loose underwriting in leveraged loans; a slowing economy should put pressure on those sectors. Agency MBS should broadly outperform corporate debt.
The view in credit fundamentals
Household balance sheets continue to look strong, but corporate balance sheets have started to do some work, too. Companies have started to divert cash flow toward paying down debt, have started to sell non-core assets and have curtailed stock buybacks. The ratio of household debt service to disposable income is at a record low, corporate leverage at a relative high. The Fed has signaled that it stands ready to buffer any material softening in growth.
This material is intended only for institutional investors and does not carry all of the independence and disclosure standards of retail debt research reports. In the preparation of this material, the author may have consulted or otherwise discussed the matters referenced herein with one or more of SCM’s trading desks, any of which may have accumulated or otherwise taken a position, long or short, in any of the financial instruments discussed in or related to this material. Further, SCM may act as a market maker or principal dealer and may have proprietary interests that differ or conflict with the recipient hereof, in connection with any financial instrument discussed in or related to this material.
This message, including any attachments or links contained herein, is subject to important disclaimers, conditions, and disclosures regarding Electronic Communications, which you can find at https://portfolio-strategy.apsec.com/sancap-disclaimers-and-disclosures.
Important Disclaimers
Copyright © 2026 Santander US Capital Markets LLC and its affiliates (“SCM”). All rights reserved. SCM is a member of FINRA and SIPC. This material is intended for limited distribution to institutions only and is not publicly available. Any unauthorized use or disclosure is prohibited.
In making this material available, SCM (i) is not providing any advice to the recipient, including, without limitation, any advice as to investment, legal, accounting, tax and financial matters, (ii) is not acting as an advisor or fiduciary in respect of the recipient, (iii) is not making any predictions or projections and (iv) intends that any recipient to which SCM has provided this material is an “institutional investor” (as defined under applicable law and regulation, including FINRA Rule 4512 and that this material will not be disseminated, in whole or part, to any third party by the recipient.
The author of this material is an economist, desk strategist or trader. In the preparation of this material, the author may have consulted or otherwise discussed the matters referenced herein with one or more of SCM’s trading desks, any of which may have accumulated or otherwise taken a position, long or short, in any of the financial instruments discussed in or related to this material. Further, SCM or any of its affiliates may act as a market maker or principal dealer and may have proprietary interests that differ or conflict with the recipient hereof, in connection with any financial instrument discussed in or related to this material.
This material (i) has been prepared for information purposes only and does not constitute a solicitation or an offer to buy or sell any securities, related investments or other financial instruments, (ii) is neither research, a “research report” as commonly understood under the securities laws and regulations promulgated thereunder nor the product of a research department, (iii) or parts thereof may have been obtained from various sources, the reliability of which has not been verified and cannot be guaranteed by SCM, (iv) should not be reproduced or disclosed to any other person, without SCM’s prior consent and (v) is not intended for distribution in any jurisdiction in which its distribution would be prohibited.
In connection with this material, SCM (i) makes no representation or warranties as to the appropriateness or reliance for use in any transaction or as to the permissibility or legality of any financial instrument in any jurisdiction, (ii) believes the information in this material to be reliable, has not independently verified such information and makes no representation, express or implied, with regard to the accuracy or completeness of such information, (iii) accepts no responsibility or liability as to any reliance placed, or investment decision made, on the basis of such information by the recipient and (iv) does not undertake, and disclaims any duty to undertake, to update or to revise the information contained in this material.
Unless otherwise stated, the views, opinions, forecasts, valuations, or estimates contained in this material are those solely of the author, as of the date of publication of this material, and are subject to change without notice. The recipient of this material should make an independent evaluation of this information and make such other investigations as the recipient considers necessary (including obtaining independent financial advice), before transacting in any financial market or instrument discussed in or related to this material.
Important disclaimers for clients in the EU and UK
This publication has been prepared by Trading Desk Strategists within the Sales and Trading functions of Santander US Capital Markets LLC (“SanCap”), the US registered broker-dealer of Santander Corporate & Investment Banking. This communication is distributed in the EEA by Banco Santander S.A., a credit institution registered in Spain and authorised and regulated by the Bank of Spain and the CNMV. Any EEA recipient of this communication that would like to affect any transaction in any security or issuer discussed herein should do so with Banco Santander S.A. or any of its affiliates (together “Santander”). This communication has been distributed in the UK by Banco Santander, S.A.’s London branch, authorised by the Bank of Spain and subject to regulatory oversight on certain matters by the Financial Conduct Authority (FCA) and the Prudential Regulation Authority (PRA).
The publication is intended for exclusive use for Professional Clients and Eligible Counterparties as defined by MiFID II and is not intended for use by retail customers or for any persons or entities in any jurisdictions or country where such distribution or use would be contrary to local law or regulation.
This material is not a product of Santander´s Research Team and does not constitute independent investment research. This is a marketing communication and may contain ¨investment recommendations¨ as defined by the Market Abuse Regulation 596/2014 ("MAR"). This publication has not been prepared in accordance with legal requirements designed to promote the independence of research and is not subject to any prohibition on dealing ahead of the dissemination of investment research. The author, date and time of the production of this publication are as indicated herein.
This publication does not constitute investment advice and may not be relied upon to form an investment decision, nor should it be construed as any offer to sell or issue or invitation to purchase, acquire or subscribe for any instruments referred herein. The publication has been prepared in good faith and based on information Santander considers reliable as of the date of publication, but Santander does not guarantee or represent, express or implied, that such information is accurate or complete. All estimates, forecasts and opinions are current as at the date of this publication and are subject to change without notice. Unless otherwise indicated, Santander does not intend to update this publication. The views and commentary in this publication may not be objective or independent of the interests of the Trading and Sales functions of Santander, who may be active participants in the markets, investments or strategies referred to herein and/or may receive compensation from investment banking and non-investment banking services from entities mentioned herein. Santander may trade as principal, make a market or hold positions in instruments (or related derivatives) and/or hold financial interest in entities discussed herein. Santander may provide market commentary or trading strategies to other clients or engage in transactions which may differ from views expressed herein. Santander may have acted upon the contents of this publication prior to you having received it.
This publication is intended for the exclusive use of the recipient and must not be reproduced, redistributed or transmitted, in whole or in part, without Santander’s consent. The recipient agrees to keep confidential at all times information contained herein.


