Uncategorized
Productivity growth and the sugar high
admin | March 29, 2019
This material is a Marketing Communication and does not constitute Independent Investment Research.
The prevailing view is that the 2017 tax cut produced a classic example of fiscal stimulus: a boost to the demand side of the economy which moves through the system quickly and then dissipates, producing a so-called sugar high for the economy. However, the 2017 tax reform mainly impacted the economy by improving incentives for businesses to invest, not by providing households with a one-off cash injection. An overwhelming proportion of economists and market participants are convinced that the economy will decelerate sharply in 2019, partly due to an erosion of fiscal stimulus. This year will provide a crucial test of dueling narratives of how fiscal policy affects the economy. A key metric that will help settle the debate is productivity growth. A pickup in efficiency gains on the back of strong investment growth last year suggests that the tax reform’s economic boost has a substantial supply side component, and thus will have staying power in 2019 and likely beyond.
Business investment surges
The 2017 corporate tax reform had three key provisions that encouraged more business investment.
- First, the top marginal corporate income tax rate was slashed.
- Second, a change in how income is taxed reduced the incentive for firms to relocate overseas.
- Third, and most importantly, corporations are now allowed to fully expense many types of investments for tax purposes in the first year rather than following a multi-year depreciation schedule.
The combination of these three changes should provide a boost to business investment that lasts a lot longer than two or three quarters, which is the duration of the already-dissipated sugar high contention of the consensus.
In reality, business fixed investment exhibited strength throughout 2018, rising at a 7.0% annualized clip over the four quarters of last year, up from an already-robust 6.3% rise in 2017 (by comparison, this aggregate declined by 0.7% in 2015 and rose by an anemic 1.8% in 2016). The sugar-high crowd got excited when business fixed investment cooled in the third quarter, advancing at only a 2.5% pace. By the time fourth quarter GDP figures came out in February, showing a rebound to over 5% annualized growth, the narrative of sagging business investment growth had already taken root, and analysts were seemingly uninterested in evidence that did not promote the story.
The most striking performance within the business investment aggregate last year was the intellectual property component, which mainly consists of research and development outlays and purchases of software. Growth in this category had trended in the mid-single digits through 2017 but exploded higher by 10.2% last year. As with the broader aggregate, sugar-high proponents were quick to declare an end to the strong performance after the quarterly advance slowed to 5.6% in Q3, but Q4 returned to double-digit growth (for the third quarter out of four last year). This is the very best kind of investment to see, as these sorts of outlays are most likely to yield long-lasting gains in labor productivity by transforming business practices, and/or creating all new products and services to sell to consumers and businesses.
Productivity growth follows
One of the defining characteristics of the anemic expansion from 2009 through 2016 was that business investment was sub-par through most of the period. When businesses are not spending to improve their operations, it is difficult for workers to become more productive. It is no coincidence that productivity growth slowed to an abysmal 0.6% annual average from 2011 through 2016 (see Exhibit 1).
Exhibit 1: Nonfarm business productivity growth (Q4/Q4)
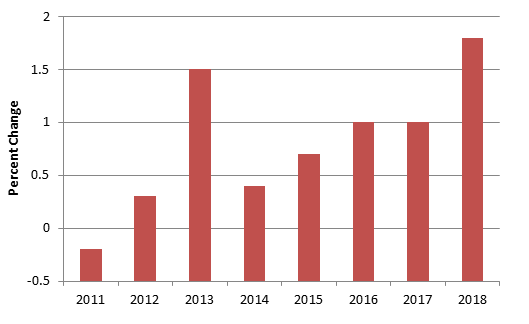
Source: BLS
The pickup in business investment in 2017 and 2018 has already yielded benefits in terms of productivity growth, which posted a 1.0% advance in 2017 and a 1.8% rise in 2018, the best annual performance since 2009.
2019: Make-or-break year
This year will be the pivotal one for settling the debate over whether the effects of corporate tax reform were brief and already past or will continue for an extended period. The year is likely to have gotten off to a sluggish start, as uncertainties related to the federal government shutdown and the possibility of tariff hikes reportedly led many firms to retreat to the sidelines to allow the dust to settle. However, if the completion of a trade deal in the spring provides greater certainty, businesses should resume a robust clip of investment growth, as they continue to take advantage of the improved tax and regulatory environment. Business fixed investment will almost certainly slow after a stellar 2018 performance, but another annual rise in the 5% range would suggest persistent strength and help to propel the economy to another period of growth well above 2%. In contrast, the latest Blue Chip consensus calls for a gain of closer to 3% in 2019, consistent with a moderation to around 2% overall GDP growth.
Implications of faster productivity growth
If productivity growth is moving persistently higher, there are wide-ranging and meaningful implications for the medium-term economic outlook. First, an acceleration in productivity growth is a sure path to a non-inflationary pickup in wage gains. If workers are able to produce more widgets per hour due to a better assembly line, companies can afford to pay them more without having to raise widget prices – further loosening the link between wage hikes and inflation. Second, an acceleration in trend productivity growth should translate on a one-for-one basis to potential real GDP growth. The economy’s potential growth rate is generally thought to equal the sum of the increase in labor supply and productivity growth. The former depends mostly on demographics and is currently running close to ¾% per year. Thus, trend productivity growth in the neighborhood of ½%, where it averaged from 2011 through 2016, implies potential growth of about 1¼%, well below the FOMC’s 1.8% long-run estimate, which likely explains why the unemployment rate fell so rapidly during that time period despite lackluster GDP growth. In contrast, if productivity growth is accelerating on a persistent basis, say to 1.5%, then potential real GDP growth is suddenly above 2%. Third, if trend growth is higher, then the equilibrium real interest rate for the economy, what the Fed calls r*, should also be higher, on pretty close to a one-for-one basis. While higher productivity growth reduces inflationary pressures for any given growth outcome in the short run, by raising the return on investment, it requires a higher interest rate to reach equilibrium, which means higher “neutral” interest rates in the long run. There are numerous other major implications of faster trend productivity growth, nearly all of them good, e.g. lower budget deficits all else equal, so the business investment and productivity figures will be worth keeping a close eye on in 2019.
This material is intended only for institutional investors and does not carry all of the independence and disclosure standards of retail debt research reports. In the preparation of this material, the author may have consulted or otherwise discussed the matters referenced herein with one or more of SCM’s trading desks, any of which may have accumulated or otherwise taken a position, long or short, in any of the financial instruments discussed in or related to this material. Further, SCM may act as a market maker or principal dealer and may have proprietary interests that differ or conflict with the recipient hereof, in connection with any financial instrument discussed in or related to this material.
This message, including any attachments or links contained herein, is subject to important disclaimers, conditions, and disclosures regarding Electronic Communications, which you can find at https://portfolio-strategy.apsec.com/sancap-disclaimers-and-disclosures.
Important Disclaimers
Copyright © 2026 Santander US Capital Markets LLC and its affiliates (“SCM”). All rights reserved. SCM is a member of FINRA and SIPC. This material is intended for limited distribution to institutions only and is not publicly available. Any unauthorized use or disclosure is prohibited.
In making this material available, SCM (i) is not providing any advice to the recipient, including, without limitation, any advice as to investment, legal, accounting, tax and financial matters, (ii) is not acting as an advisor or fiduciary in respect of the recipient, (iii) is not making any predictions or projections and (iv) intends that any recipient to which SCM has provided this material is an “institutional investor” (as defined under applicable law and regulation, including FINRA Rule 4512 and that this material will not be disseminated, in whole or part, to any third party by the recipient.
The author of this material is an economist, desk strategist or trader. In the preparation of this material, the author may have consulted or otherwise discussed the matters referenced herein with one or more of SCM’s trading desks, any of which may have accumulated or otherwise taken a position, long or short, in any of the financial instruments discussed in or related to this material. Further, SCM or any of its affiliates may act as a market maker or principal dealer and may have proprietary interests that differ or conflict with the recipient hereof, in connection with any financial instrument discussed in or related to this material.
This material (i) has been prepared for information purposes only and does not constitute a solicitation or an offer to buy or sell any securities, related investments or other financial instruments, (ii) is neither research, a “research report” as commonly understood under the securities laws and regulations promulgated thereunder nor the product of a research department, (iii) or parts thereof may have been obtained from various sources, the reliability of which has not been verified and cannot be guaranteed by SCM, (iv) should not be reproduced or disclosed to any other person, without SCM’s prior consent and (v) is not intended for distribution in any jurisdiction in which its distribution would be prohibited.
In connection with this material, SCM (i) makes no representation or warranties as to the appropriateness or reliance for use in any transaction or as to the permissibility or legality of any financial instrument in any jurisdiction, (ii) believes the information in this material to be reliable, has not independently verified such information and makes no representation, express or implied, with regard to the accuracy or completeness of such information, (iii) accepts no responsibility or liability as to any reliance placed, or investment decision made, on the basis of such information by the recipient and (iv) does not undertake, and disclaims any duty to undertake, to update or to revise the information contained in this material.
Unless otherwise stated, the views, opinions, forecasts, valuations, or estimates contained in this material are those solely of the author, as of the date of publication of this material, and are subject to change without notice. The recipient of this material should make an independent evaluation of this information and make such other investigations as the recipient considers necessary (including obtaining independent financial advice), before transacting in any financial market or instrument discussed in or related to this material.
Important disclaimers for clients in the EU and UK
This publication has been prepared by Trading Desk Strategists within the Sales and Trading functions of Santander US Capital Markets LLC (“SanCap”), the US registered broker-dealer of Santander Corporate & Investment Banking. This communication is distributed in the EEA by Banco Santander S.A., a credit institution registered in Spain and authorised and regulated by the Bank of Spain and the CNMV. Any EEA recipient of this communication that would like to affect any transaction in any security or issuer discussed herein should do so with Banco Santander S.A. or any of its affiliates (together “Santander”). This communication has been distributed in the UK by Banco Santander, S.A.’s London branch, authorised by the Bank of Spain and subject to regulatory oversight on certain matters by the Financial Conduct Authority (FCA) and the Prudential Regulation Authority (PRA).
The publication is intended for exclusive use for Professional Clients and Eligible Counterparties as defined by MiFID II and is not intended for use by retail customers or for any persons or entities in any jurisdictions or country where such distribution or use would be contrary to local law or regulation.
This material is not a product of Santander´s Research Team and does not constitute independent investment research. This is a marketing communication and may contain ¨investment recommendations¨ as defined by the Market Abuse Regulation 596/2014 ("MAR"). This publication has not been prepared in accordance with legal requirements designed to promote the independence of research and is not subject to any prohibition on dealing ahead of the dissemination of investment research. The author, date and time of the production of this publication are as indicated herein.
This publication does not constitute investment advice and may not be relied upon to form an investment decision, nor should it be construed as any offer to sell or issue or invitation to purchase, acquire or subscribe for any instruments referred herein. The publication has been prepared in good faith and based on information Santander considers reliable as of the date of publication, but Santander does not guarantee or represent, express or implied, that such information is accurate or complete. All estimates, forecasts and opinions are current as at the date of this publication and are subject to change without notice. Unless otherwise indicated, Santander does not intend to update this publication. The views and commentary in this publication may not be objective or independent of the interests of the Trading and Sales functions of Santander, who may be active participants in the markets, investments or strategies referred to herein and/or may receive compensation from investment banking and non-investment banking services from entities mentioned herein. Santander may trade as principal, make a market or hold positions in instruments (or related derivatives) and/or hold financial interest in entities discussed herein. Santander may provide market commentary or trading strategies to other clients or engage in transactions which may differ from views expressed herein. Santander may have acted upon the contents of this publication prior to you having received it.
This publication is intended for the exclusive use of the recipient and must not be reproduced, redistributed or transmitted, in whole or in part, without Santander’s consent. The recipient agrees to keep confidential at all times information contained herein.


