Uncategorized
Spread markets should do well
admin | March 22, 2019
This material is a Marketing Communication and does not constitute Independent Investment Research.
Despite the reshaping of the yield curve since the beginning of March, the market has put its money not on recession but on an economy that weakens in 2020 and rebounds a year or two later. That’s the story in a curve inverted from one month out to five years but positively sloped beyond. It’s also the story in spread markets, which have tightened since late last year but still stand wide of earlier marks. With risk premium built in for softer growth, spread markets look likely to do well.
The message in the rates markets
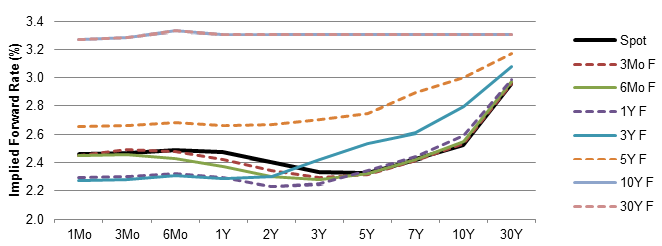
Today’s implied forward rates show a yield curve in early 2020 that essentially runs flat from one month out to five years, completely undoing the inversion in today’s spot curve (Exhibit 1). That obviously implies one Fed rate cut roughly a year from now, but no more. That would be entirely consistent with economic projections from the Congressional Budget Office and the Fed that continue to show economic growth softening into 2020 to just under 2.0% before rebounding slightly in later years. That is the same pattern, incidentally, that both the CBO and Fed have projected since last spring. It seems entirely reasonable that short rates should fall to accommodate slower growth before rebounding.
Exhibit 1: Forward rates imply a drop and a rebound
Source: Bloomberg as of March 21, 2019; Amherst Pierpont Securities
What is also striking is the message across the yield curves implied 10- and 30-years forward. They are both essentially flat at around 3.30%. That is an easy level to justify assuming real rates of 1.30% and inflation of 2.00%. Real rates often run about 50 bp below real GDP growth, which the Fed now projects somewhere between 1.8% and 2.0%. The Fed projections almost certainly reflect widely discussed expectations for 0.50% annual growth in the labor force and 1.30% annual growth in productivity. Market expectations for growth and inflation in the long run should pull rates up off the levels implied for 2020.
If the market has mispriced something, the best candidate looks like the prospects for US growth implied in 10-year yields. Yields on 10-year TIPS have dipped toward 0.50% as implied 10-year inflation has rebounded back towards the Fed’s 2.0% target. That almost certainly reflects justifiable concerns about global growth but seems misplaced in the US. Yields on 10-year notes may continue to reflect low growth expectations as growth slows this year, but yields should rebound once growth stabilizes.
Exhibit 2: The market has continued to revise growth expectations lower
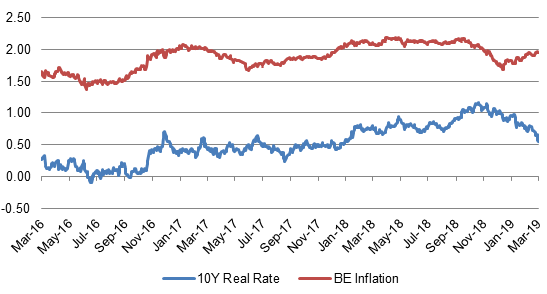
Source: Bloomberg as of March 21, 2019; Amherst Pierpont Securities
The message in spread markets
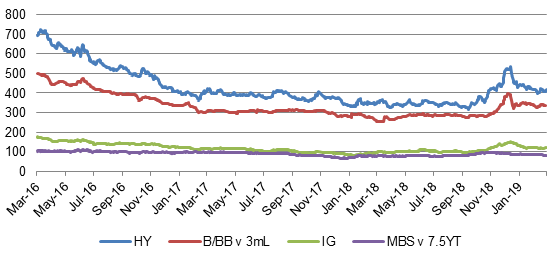
If the inversion of the 5-year and shorter part of the Treasury curve reflected recession rather than slowing growth, then spreads should have moved wider than they have so far in March. They have widened slightly in the last few trading sessions but still stand much tighter than they did at the end of last year when Fed projections of steady hikes did raise recession risk (Exhibit 3). If late 2018 spread levels indicate recession pricing, the market is not there yet.
The spread markets have arguably built in some risk premium for a slower economy, however. In high yield, leveraged loans, investment grade credit and MBS, spreads still stand wide of levels in mid-2018 when real GDP peaked at 4.2%. The wider spreads almost certainly reflect the observed slowing the GDP growth and likely at least some expectations for more. That risk premium should give spread markets some cushion.
Exhibit 3: Spread markets have built in some risk premium for slower growth
Source: Bloomberg, Amherst Pierpont Securities
The other factor favoring spread markets is the heavy projected US fiscal deficits and accompanying net issuance of Treasury debt. As Treasury supply grows relative to spread markets, spreads historically have tightened (Exhibit 4). This is a significant tide running in favor of tighter spreads across high yield, leveraged loans, investment grade debt and MBS.
Exhibit 4: US deficits and heavy Treasury supply coincide with tighter spreads
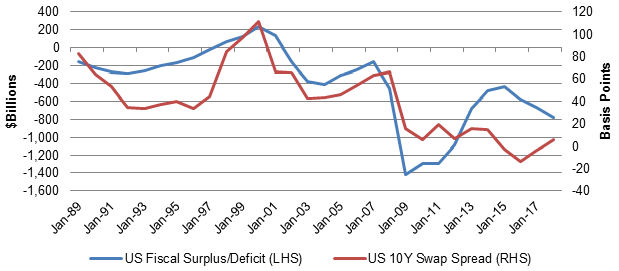
Source: Bloomberg, Amherst Pierpont Securities
Slightly wider spreads in risk assets in the aftermath of the March FOMC look like a buying opportunity for fixed income investors. The economy looks more likely to slow than to tip into recession, and spread markets have built in appropriate risk premiums. The Fed is also signaling an abundance of caution in doing anything that might impinge growth. Spread markets should do well.
* * *
The view in rates
The 2.44% rate on 10-year Treasury notes still looks rich to fair value but undoubtedly reflects slowing global growth and a very dovish Fed. The 2.32% rate on 2-year notes has also has built in at least one if not two Fed rate cuts in the next two years, another signal of growth concerns. And 10-year TIPS continue to reflect falling growth expectations. The growth concerns seem hard to justify. Look for the yield curve at 10-years and in move higher in yield from here.
With the yield curve inverted out to five years and upwardly sloped beyond, investors will have to pick their yield curve spots carefully, especially when it comes to hedging. The yield curve at five years and shorter now has negative roll-down, the curve beyond five years has positive roll-down.
The view in spreads
The shape of the yield curve should put pressure on spread product with 5-year or shorter maturities with spreads widening to offset a negative roll-down. Shorter MBS, without bulleted principal that rolls down a yield curve, should look relatively better.
In general, low volatility and heavy net Treasury supply should help spread products to tighten. The corporate market still has issues with leverage in investment grade debt and loose underwriting in leveraged loans; a slowing economy should put pressure on those sectors. Agency MBS should broadly outperform corporate debt.
The view in credit fundamentals
Household balance sheets continue to look strong and corporate balance sheets vulnerable—although more corporations have started to divert cash flow toward paying down debt, have started to sell non-core assets and have curtailed stock buybacks. The ratio of household debt service to disposable income is at a record low, corporate leverage at a relative high. The Fed has signaled that it stands ready to buffer any material softening in growth.
This material is intended only for institutional investors and does not carry all of the independence and disclosure standards of retail debt research reports. In the preparation of this material, the author may have consulted or otherwise discussed the matters referenced herein with one or more of SCM’s trading desks, any of which may have accumulated or otherwise taken a position, long or short, in any of the financial instruments discussed in or related to this material. Further, SCM may act as a market maker or principal dealer and may have proprietary interests that differ or conflict with the recipient hereof, in connection with any financial instrument discussed in or related to this material.
This message, including any attachments or links contained herein, is subject to important disclaimers, conditions, and disclosures regarding Electronic Communications, which you can find at https://portfolio-strategy.apsec.com/sancap-disclaimers-and-disclosures.
Important Disclaimers
Copyright © 2026 Santander US Capital Markets LLC and its affiliates (“SCM”). All rights reserved. SCM is a member of FINRA and SIPC. This material is intended for limited distribution to institutions only and is not publicly available. Any unauthorized use or disclosure is prohibited.
In making this material available, SCM (i) is not providing any advice to the recipient, including, without limitation, any advice as to investment, legal, accounting, tax and financial matters, (ii) is not acting as an advisor or fiduciary in respect of the recipient, (iii) is not making any predictions or projections and (iv) intends that any recipient to which SCM has provided this material is an “institutional investor” (as defined under applicable law and regulation, including FINRA Rule 4512 and that this material will not be disseminated, in whole or part, to any third party by the recipient.
The author of this material is an economist, desk strategist or trader. In the preparation of this material, the author may have consulted or otherwise discussed the matters referenced herein with one or more of SCM’s trading desks, any of which may have accumulated or otherwise taken a position, long or short, in any of the financial instruments discussed in or related to this material. Further, SCM or any of its affiliates may act as a market maker or principal dealer and may have proprietary interests that differ or conflict with the recipient hereof, in connection with any financial instrument discussed in or related to this material.
This material (i) has been prepared for information purposes only and does not constitute a solicitation or an offer to buy or sell any securities, related investments or other financial instruments, (ii) is neither research, a “research report” as commonly understood under the securities laws and regulations promulgated thereunder nor the product of a research department, (iii) or parts thereof may have been obtained from various sources, the reliability of which has not been verified and cannot be guaranteed by SCM, (iv) should not be reproduced or disclosed to any other person, without SCM’s prior consent and (v) is not intended for distribution in any jurisdiction in which its distribution would be prohibited.
In connection with this material, SCM (i) makes no representation or warranties as to the appropriateness or reliance for use in any transaction or as to the permissibility or legality of any financial instrument in any jurisdiction, (ii) believes the information in this material to be reliable, has not independently verified such information and makes no representation, express or implied, with regard to the accuracy or completeness of such information, (iii) accepts no responsibility or liability as to any reliance placed, or investment decision made, on the basis of such information by the recipient and (iv) does not undertake, and disclaims any duty to undertake, to update or to revise the information contained in this material.
Unless otherwise stated, the views, opinions, forecasts, valuations, or estimates contained in this material are those solely of the author, as of the date of publication of this material, and are subject to change without notice. The recipient of this material should make an independent evaluation of this information and make such other investigations as the recipient considers necessary (including obtaining independent financial advice), before transacting in any financial market or instrument discussed in or related to this material.
Important disclaimers for clients in the EU and UK
This publication has been prepared by Trading Desk Strategists within the Sales and Trading functions of Santander US Capital Markets LLC (“SanCap”), the US registered broker-dealer of Santander Corporate & Investment Banking. This communication is distributed in the EEA by Banco Santander S.A., a credit institution registered in Spain and authorised and regulated by the Bank of Spain and the CNMV. Any EEA recipient of this communication that would like to affect any transaction in any security or issuer discussed herein should do so with Banco Santander S.A. or any of its affiliates (together “Santander”). This communication has been distributed in the UK by Banco Santander, S.A.’s London branch, authorised by the Bank of Spain and subject to regulatory oversight on certain matters by the Financial Conduct Authority (FCA) and the Prudential Regulation Authority (PRA).
The publication is intended for exclusive use for Professional Clients and Eligible Counterparties as defined by MiFID II and is not intended for use by retail customers or for any persons or entities in any jurisdictions or country where such distribution or use would be contrary to local law or regulation.
This material is not a product of Santander´s Research Team and does not constitute independent investment research. This is a marketing communication and may contain ¨investment recommendations¨ as defined by the Market Abuse Regulation 596/2014 ("MAR"). This publication has not been prepared in accordance with legal requirements designed to promote the independence of research and is not subject to any prohibition on dealing ahead of the dissemination of investment research. The author, date and time of the production of this publication are as indicated herein.
This publication does not constitute investment advice and may not be relied upon to form an investment decision, nor should it be construed as any offer to sell or issue or invitation to purchase, acquire or subscribe for any instruments referred herein. The publication has been prepared in good faith and based on information Santander considers reliable as of the date of publication, but Santander does not guarantee or represent, express or implied, that such information is accurate or complete. All estimates, forecasts and opinions are current as at the date of this publication and are subject to change without notice. Unless otherwise indicated, Santander does not intend to update this publication. The views and commentary in this publication may not be objective or independent of the interests of the Trading and Sales functions of Santander, who may be active participants in the markets, investments or strategies referred to herein and/or may receive compensation from investment banking and non-investment banking services from entities mentioned herein. Santander may trade as principal, make a market or hold positions in instruments (or related derivatives) and/or hold financial interest in entities discussed herein. Santander may provide market commentary or trading strategies to other clients or engage in transactions which may differ from views expressed herein. Santander may have acted upon the contents of this publication prior to you having received it.
This publication is intended for the exclusive use of the recipient and must not be reproduced, redistributed or transmitted, in whole or in part, without Santander’s consent. The recipient agrees to keep confidential at all times information contained herein.


