Uncategorized
Emerging prepayment patterns in non-QM RMBS
admin | March 22, 2019
This material is a Marketing Communication and does not constitute Independent Investment Research.
Prepayments in non-QM mortgage trusts remain elevated, but not all non-QM trusts are the same. The trusts reflect an amalgamation of credit profiles, documentation and occupancy types. Borrowers with lower credit scores have prepaid relatively faster than borrowers with higher scores, loans with full documentation have prepaid faster than loans with limited documentation, and owner-occupied loans have prepaid faster than investor loans. Collateral mix looks set to be a key part of relative value in RMBS 2.0.
Faster speeds in low FICO loans
Prepayments in non-QM mortgage trusts generally have run faster than other private-label securitizations, but speeds across trusts have not been uniform. The differences reflect variations in collateral from trust to trust and shelf to shelf. Speeds tend to run somewhat slower on shelves closer to prime and faster on shelves with more non-prime (Exhibit 1). Intuition might suggest greater credit availability and less refinancing friction for prime loans, but non-prime shelves show the effect of credit curing.
Exhibit 1: Constant repayment rates across non-QM shelves by loan age
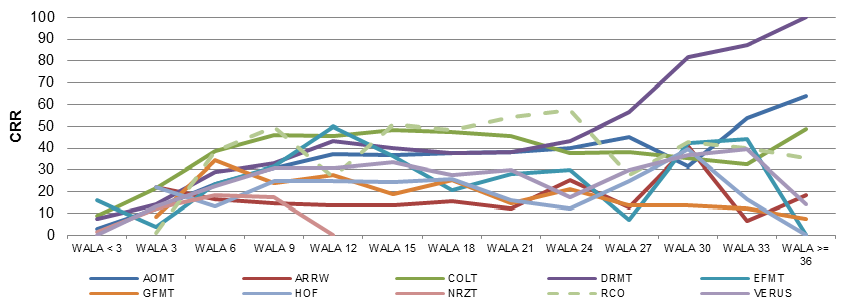
Source: Amherst Insight Labs, Amherst Pierpont Securities
Cutting prepayments by FICO and seasoning in non-QM trusts shows that lower FICO loans have by and large paid at least as fast if not faster than prime borrowers. Absolute prepayment rates accelerate on lower FICO loans as they season, a pattern attributable to credit curing as credit scores improve and past credit events recede into the past. Prepayments also may be fueled by a modest relaxation of underwriting standards in recent years. Loans with an average original FICO score of 640 to 660 with three months of seasoning have prepaid at roughly 13 CRR. With 30 months of seasoning, they prepay around 60 CRR. Loans with an original FICO score of 760 to 780 with three months of seasoning have prepaid at roughly 17 CRR. With 30 months of seasoning, they prepay around 20 CRR or below (Exhibit 2).
Exhibit 2: Constant prepayment rates by FICO score and loan age
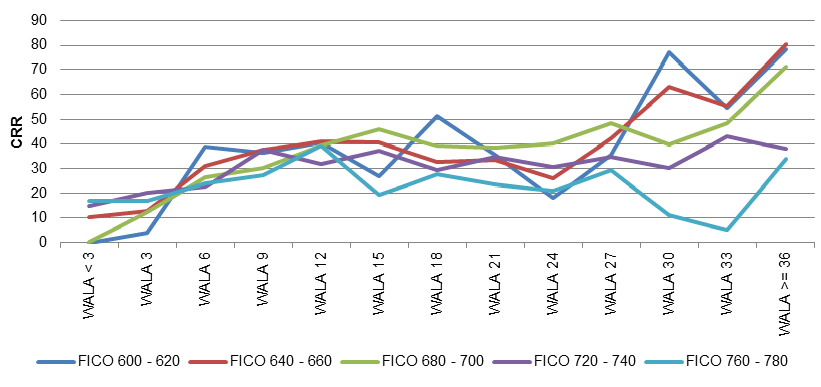
Source: Amherst Insight Labs, Amherst Pierpont Securities
Faster speeds in full documentation loans
Non-QM trusts also contain limited document loans in varying amounts. Non-QM underwriting often uses bank statements to verify assets and income using anywhere from two years of statements to as little as one month. Additionally, non-QM underwriting can use asset depletion to qualify borrowers. Asset depletion uses a borrower’s liquid assets to qualify them for a mortgage. This is generally calculated by drawing down a borrower’s assets over a fixed period of time to determine an ability to repay the loan. The lender often makes assumptions about the borrower’s ability to sell or liquidate assets over time. Additionally, investors in rental properties can qualify based on the expected rental income that the property can generate. Although not controlling for key attributes that drive prepayments like WAC, refi incentive and loan size, fully documented loans in non-QM trusts have paid roughly 10 CRR faster than limited document loans (Exhibit 3).
Exhibit 3: Cumulative repayment rate on full and alternative documentation loans across QM
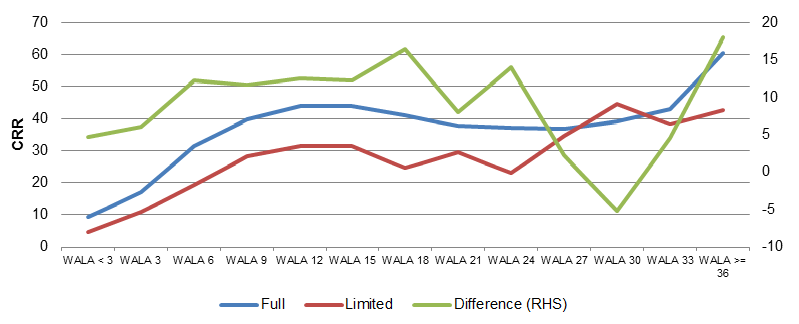
Source: Amherst Insight Labs, Amherst Pierpont Securities
After controlling for refinancing incentive—gross WAC over the PMMS rate with a six-week lag—full documentation loans have prepaid approximately 11 CRR faster than limited documentation loans. Full doc loans have generally prepaid over 32 CRR with limited document loans averaging just over 21 CRR. The largest divergences came in deep in-the-money loans where full doc loans with 3.5 points of refi incentive paid nearly 20 CRR faster than limited doc ones, and those with 4.5 points of refi incentive paid 21 CRR faster.
Compensating collateral characteristics can level the playing field when it comes to limited documentation loans in non-QM. In lower CLTV buckets, alternative document loans with enough seasoning can actually prepay faster than full doc loans, likely a result of tightening risk premiums over time on less risky, limited doc loans. Conversely, prepayment rates on higher CLTV loans are substantially higher with full documentation; full doc loans with greater than 90 CLTVs, at one extreme, have been 50 CRR faster than limited doc ones (Exhibit 4).
Exhibit 4: Constant repayment rate differences by documentation and original CLTV
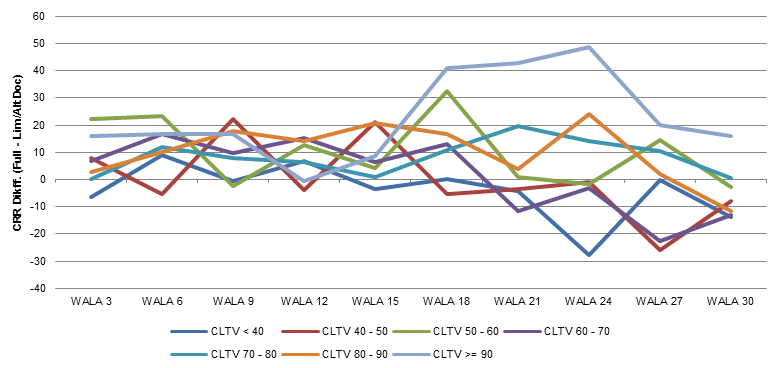
Source: Amherst Insight Labs, Amherst Pierpont Securities. Note: Observations >30 WALA excluded due to limited sample across buckets.
Slower speeds in investor loans
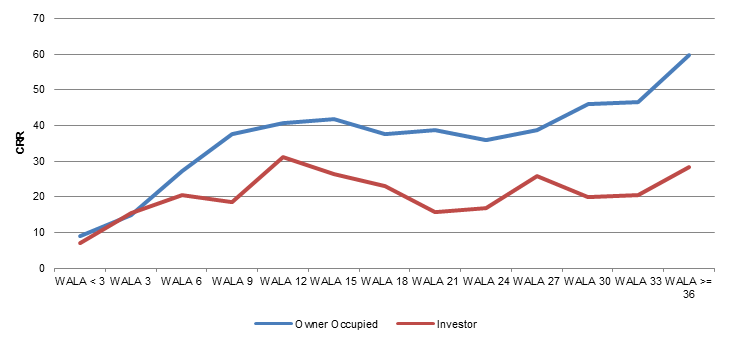
Speeds on investor loans were significantly slower than owner occupied ones. In aggregate, investor loans have prepaid 16 CRR slower than primary residences. Controlling for refi incentive, investor loans still prepay 11 CRR slower than owner-occupied ones. Comparing investor and owner-occupied loans with similar FICOs or LTVs generally suggest that investor loans run consistently slower than owner-occupied ones even in stronger credits with less friction to refinancing. Given this, investor loans may provide attractive prepay protection in otherwise fast paying non-QM deals. (Exhibit 5)
Exhibit 5: Cumulative repayment rates by occupancy status
Source: Amherst Insight Labs, Amherst Pierpont Securities
This material is intended only for institutional investors and does not carry all of the independence and disclosure standards of retail debt research reports. In the preparation of this material, the author may have consulted or otherwise discussed the matters referenced herein with one or more of SCM’s trading desks, any of which may have accumulated or otherwise taken a position, long or short, in any of the financial instruments discussed in or related to this material. Further, SCM may act as a market maker or principal dealer and may have proprietary interests that differ or conflict with the recipient hereof, in connection with any financial instrument discussed in or related to this material.
This message, including any attachments or links contained herein, is subject to important disclaimers, conditions, and disclosures regarding Electronic Communications, which you can find at https://portfolio-strategy.apsec.com/sancap-disclaimers-and-disclosures.
Important Disclaimers
Copyright © 2026 Santander US Capital Markets LLC and its affiliates (“SCM”). All rights reserved. SCM is a member of FINRA and SIPC. This material is intended for limited distribution to institutions only and is not publicly available. Any unauthorized use or disclosure is prohibited.
In making this material available, SCM (i) is not providing any advice to the recipient, including, without limitation, any advice as to investment, legal, accounting, tax and financial matters, (ii) is not acting as an advisor or fiduciary in respect of the recipient, (iii) is not making any predictions or projections and (iv) intends that any recipient to which SCM has provided this material is an “institutional investor” (as defined under applicable law and regulation, including FINRA Rule 4512 and that this material will not be disseminated, in whole or part, to any third party by the recipient.
The author of this material is an economist, desk strategist or trader. In the preparation of this material, the author may have consulted or otherwise discussed the matters referenced herein with one or more of SCM’s trading desks, any of which may have accumulated or otherwise taken a position, long or short, in any of the financial instruments discussed in or related to this material. Further, SCM or any of its affiliates may act as a market maker or principal dealer and may have proprietary interests that differ or conflict with the recipient hereof, in connection with any financial instrument discussed in or related to this material.
This material (i) has been prepared for information purposes only and does not constitute a solicitation or an offer to buy or sell any securities, related investments or other financial instruments, (ii) is neither research, a “research report” as commonly understood under the securities laws and regulations promulgated thereunder nor the product of a research department, (iii) or parts thereof may have been obtained from various sources, the reliability of which has not been verified and cannot be guaranteed by SCM, (iv) should not be reproduced or disclosed to any other person, without SCM’s prior consent and (v) is not intended for distribution in any jurisdiction in which its distribution would be prohibited.
In connection with this material, SCM (i) makes no representation or warranties as to the appropriateness or reliance for use in any transaction or as to the permissibility or legality of any financial instrument in any jurisdiction, (ii) believes the information in this material to be reliable, has not independently verified such information and makes no representation, express or implied, with regard to the accuracy or completeness of such information, (iii) accepts no responsibility or liability as to any reliance placed, or investment decision made, on the basis of such information by the recipient and (iv) does not undertake, and disclaims any duty to undertake, to update or to revise the information contained in this material.
Unless otherwise stated, the views, opinions, forecasts, valuations, or estimates contained in this material are those solely of the author, as of the date of publication of this material, and are subject to change without notice. The recipient of this material should make an independent evaluation of this information and make such other investigations as the recipient considers necessary (including obtaining independent financial advice), before transacting in any financial market or instrument discussed in or related to this material.
Important disclaimers for clients in the EU and UK
This publication has been prepared by Trading Desk Strategists within the Sales and Trading functions of Santander US Capital Markets LLC (“SanCap”), the US registered broker-dealer of Santander Corporate & Investment Banking. This communication is distributed in the EEA by Banco Santander S.A., a credit institution registered in Spain and authorised and regulated by the Bank of Spain and the CNMV. Any EEA recipient of this communication that would like to affect any transaction in any security or issuer discussed herein should do so with Banco Santander S.A. or any of its affiliates (together “Santander”). This communication has been distributed in the UK by Banco Santander, S.A.’s London branch, authorised by the Bank of Spain and subject to regulatory oversight on certain matters by the Financial Conduct Authority (FCA) and the Prudential Regulation Authority (PRA).
The publication is intended for exclusive use for Professional Clients and Eligible Counterparties as defined by MiFID II and is not intended for use by retail customers or for any persons or entities in any jurisdictions or country where such distribution or use would be contrary to local law or regulation.
This material is not a product of Santander´s Research Team and does not constitute independent investment research. This is a marketing communication and may contain ¨investment recommendations¨ as defined by the Market Abuse Regulation 596/2014 ("MAR"). This publication has not been prepared in accordance with legal requirements designed to promote the independence of research and is not subject to any prohibition on dealing ahead of the dissemination of investment research. The author, date and time of the production of this publication are as indicated herein.
This publication does not constitute investment advice and may not be relied upon to form an investment decision, nor should it be construed as any offer to sell or issue or invitation to purchase, acquire or subscribe for any instruments referred herein. The publication has been prepared in good faith and based on information Santander considers reliable as of the date of publication, but Santander does not guarantee or represent, express or implied, that such information is accurate or complete. All estimates, forecasts and opinions are current as at the date of this publication and are subject to change without notice. Unless otherwise indicated, Santander does not intend to update this publication. The views and commentary in this publication may not be objective or independent of the interests of the Trading and Sales functions of Santander, who may be active participants in the markets, investments or strategies referred to herein and/or may receive compensation from investment banking and non-investment banking services from entities mentioned herein. Santander may trade as principal, make a market or hold positions in instruments (or related derivatives) and/or hold financial interest in entities discussed herein. Santander may provide market commentary or trading strategies to other clients or engage in transactions which may differ from views expressed herein. Santander may have acted upon the contents of this publication prior to you having received it.
This publication is intended for the exclusive use of the recipient and must not be reproduced, redistributed or transmitted, in whole or in part, without Santander’s consent. The recipient agrees to keep confidential at all times information contained herein.


