Uncategorized
Servicer impact on prepay speeds in Ginnie Mae project loans
admin | March 15, 2019
This material is a Marketing Communication and does not constitute Independent Investment Research.
It is well established that the prepayment profile of a residential mortgage loan can be impacted by the underlying servicer. Residential MBS investors often prefer pools with either a wide dispersion or particular concentration of servicers in order to dilute or enhance the servicers influence on speeds. Commercial mortgage speeds have often been considered less likely to be influenced by choice of servicer since borrowers are subject to significant prepayment penalties, more sensitive to property price appreciation, and quick to identify and take advantage of opportunities to refinance. Despite this conventional wisdom, analysis of historical speeds of Ginnie Mae project loans shows significant variation among servicers, with prepay speeds of some servicers being up to 50% faster or slower than reference cohorts. The differential impact on project loan prepay speeds may be particularly relevant in deals with high concentrations of particular servicers.
Evaluating prepayments across servicers
Agency servicer prepayment rankings are produced by comparing historical prepayment speeds of each servicer’s pools against the universe of comparable pools while controlling for most other factors that drive prepayments – including loan size, loan age, coupon, vintage, construction or non-construction loan, and prepayment penalties. The speeds of each servicer’s loans are compared to a reference cohort – that is, the universe of loans with the same characteristics. The difference between the historical CPR of the servicers pools and the CPR of the reference cohort is calculated across several horizons, and the servicers are ranked from fastest to slowest. The most recent ranking for Ginnie Mae project loan servicers across a 12-month horizon is shown in Exhibit 1.
Exhibit 1: Historical servicer speed ranking – Ginnie Mae project loans
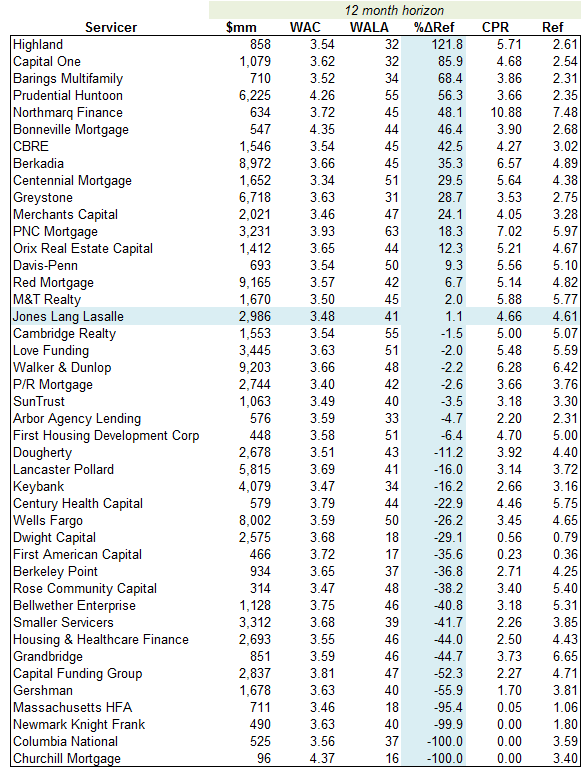
Note: March 2019, reflects February speeds. Servicer rankings are produced monthly. Links to the most recent top 40 and top 200 servicer rankings appear in the APS Portfolio Strategy Library each week. Source: Ginnie Mae, eMBS, Amherst Pierpont Securities
The column highlighted in blue indicates that the servicers are sorted from those with the highest speeds on a percentage basis relative to the underlying reference cohort, to those servicers who have the slowest speeds. The highlighted row, which in this instance corresponds to the servicer Jones Lang LaSalle, identifies the servicer whose historical prepay speeds are currently closest to those of the universe.
Applying servicer speed dispersion to project loan deals
The number of servicers represented in Ginnie Mae project loan deals varies depending on the number of loans and the size of the deal. Deals from 2010 vintage often contained 30 to 40 loans, but recent deals have become larger and more diverse, averaging 75 loans since 2016. There are 43 servicers tracked in our historical prepay table in Exhibit 1. The concentration of those servicers across deals can vary considerably. Three recent deals are compared in Exhibit 2; the three deals are reasonably similar in size, number of loans and number of loan servicers. The split between multifamily and health care loans in each deal is also very close – this is relevant because it is one factor which the historical prepay speed comparison does not control for when comparing cohorts.
Exhibit 2: Comparison of three recent Ginnie Mae project loan deals
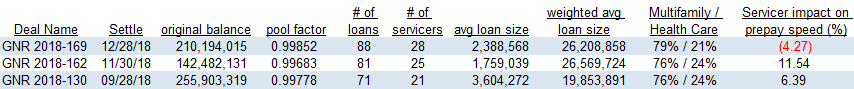
Source: Bloomberg, Amherst Pierpont Securities
The column on the far right illustrates how the weighted average servicer contribution to the deal might impact prepayment speeds. An example of the calculation for the GNR 2018-162 deal is shown in Exhibit 3. The underlying loans are aggregated by servicer, and the percentage of the deal represented by the servicer is in the second column. The third column uses the historical prepayment data, shown in Exhibit 2, that indicates over a 12-month horizon how much faster or slower has that servicers loans prepaid compared to the reference cohort. The number at the bottom is the deal weighted average of the differences in speeds based on current loan balance. It indicates that based purely on the distribution of servicers, the GNR 2018-162 deal might pay 11.5% faster than a comparable cohort of loans.
Exhibit 3: Servicer impact on prepayment speeds for GNR 2018-162
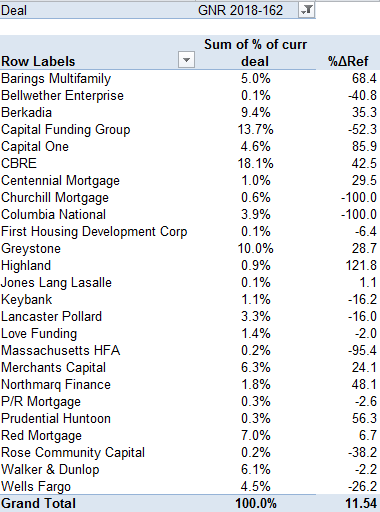
Source: Bloomberg, Amherst Pierpont Securities
The same analysis was applied to the other two deals: the GNR 2018-169 deal would be expected to prepay 4.3% slower than a reference cohort, and the GNR 2018-130 falls between the other two at 6.4% faster potential prepayment speeds.
Conclusion
The influence of servicer on Ginnie Mae prepayment speeds is material. Investors should evaluate deals for particularly high concentrations of servicers who, across multiple horizons, consistently tend to have loans which prepay at faster or slower speeds than materially equivalent collateral. The future is not necessarily going to look like the past, but it’s an additional factor that can be incorporated when evaluating project loan deals and particularly prepayment sensitive tranches, such as the IO.
This material is intended only for institutional investors and does not carry all of the independence and disclosure standards of retail debt research reports. In the preparation of this material, the author may have consulted or otherwise discussed the matters referenced herein with one or more of SCM’s trading desks, any of which may have accumulated or otherwise taken a position, long or short, in any of the financial instruments discussed in or related to this material. Further, SCM may act as a market maker or principal dealer and may have proprietary interests that differ or conflict with the recipient hereof, in connection with any financial instrument discussed in or related to this material.
This message, including any attachments or links contained herein, is subject to important disclaimers, conditions, and disclosures regarding Electronic Communications, which you can find at https://portfolio-strategy.apsec.com/sancap-disclaimers-and-disclosures.
Important Disclaimers
Copyright © 2026 Santander US Capital Markets LLC and its affiliates (“SCM”). All rights reserved. SCM is a member of FINRA and SIPC. This material is intended for limited distribution to institutions only and is not publicly available. Any unauthorized use or disclosure is prohibited.
In making this material available, SCM (i) is not providing any advice to the recipient, including, without limitation, any advice as to investment, legal, accounting, tax and financial matters, (ii) is not acting as an advisor or fiduciary in respect of the recipient, (iii) is not making any predictions or projections and (iv) intends that any recipient to which SCM has provided this material is an “institutional investor” (as defined under applicable law and regulation, including FINRA Rule 4512 and that this material will not be disseminated, in whole or part, to any third party by the recipient.
The author of this material is an economist, desk strategist or trader. In the preparation of this material, the author may have consulted or otherwise discussed the matters referenced herein with one or more of SCM’s trading desks, any of which may have accumulated or otherwise taken a position, long or short, in any of the financial instruments discussed in or related to this material. Further, SCM or any of its affiliates may act as a market maker or principal dealer and may have proprietary interests that differ or conflict with the recipient hereof, in connection with any financial instrument discussed in or related to this material.
This material (i) has been prepared for information purposes only and does not constitute a solicitation or an offer to buy or sell any securities, related investments or other financial instruments, (ii) is neither research, a “research report” as commonly understood under the securities laws and regulations promulgated thereunder nor the product of a research department, (iii) or parts thereof may have been obtained from various sources, the reliability of which has not been verified and cannot be guaranteed by SCM, (iv) should not be reproduced or disclosed to any other person, without SCM’s prior consent and (v) is not intended for distribution in any jurisdiction in which its distribution would be prohibited.
In connection with this material, SCM (i) makes no representation or warranties as to the appropriateness or reliance for use in any transaction or as to the permissibility or legality of any financial instrument in any jurisdiction, (ii) believes the information in this material to be reliable, has not independently verified such information and makes no representation, express or implied, with regard to the accuracy or completeness of such information, (iii) accepts no responsibility or liability as to any reliance placed, or investment decision made, on the basis of such information by the recipient and (iv) does not undertake, and disclaims any duty to undertake, to update or to revise the information contained in this material.
Unless otherwise stated, the views, opinions, forecasts, valuations, or estimates contained in this material are those solely of the author, as of the date of publication of this material, and are subject to change without notice. The recipient of this material should make an independent evaluation of this information and make such other investigations as the recipient considers necessary (including obtaining independent financial advice), before transacting in any financial market or instrument discussed in or related to this material.
Important disclaimers for clients in the EU and UK
This publication has been prepared by Trading Desk Strategists within the Sales and Trading functions of Santander US Capital Markets LLC (“SanCap”), the US registered broker-dealer of Santander Corporate & Investment Banking. This communication is distributed in the EEA by Banco Santander S.A., a credit institution registered in Spain and authorised and regulated by the Bank of Spain and the CNMV. Any EEA recipient of this communication that would like to affect any transaction in any security or issuer discussed herein should do so with Banco Santander S.A. or any of its affiliates (together “Santander”). This communication has been distributed in the UK by Banco Santander, S.A.’s London branch, authorised by the Bank of Spain and subject to regulatory oversight on certain matters by the Financial Conduct Authority (FCA) and the Prudential Regulation Authority (PRA).
The publication is intended for exclusive use for Professional Clients and Eligible Counterparties as defined by MiFID II and is not intended for use by retail customers or for any persons or entities in any jurisdictions or country where such distribution or use would be contrary to local law or regulation.
This material is not a product of Santander´s Research Team and does not constitute independent investment research. This is a marketing communication and may contain ¨investment recommendations¨ as defined by the Market Abuse Regulation 596/2014 ("MAR"). This publication has not been prepared in accordance with legal requirements designed to promote the independence of research and is not subject to any prohibition on dealing ahead of the dissemination of investment research. The author, date and time of the production of this publication are as indicated herein.
This publication does not constitute investment advice and may not be relied upon to form an investment decision, nor should it be construed as any offer to sell or issue or invitation to purchase, acquire or subscribe for any instruments referred herein. The publication has been prepared in good faith and based on information Santander considers reliable as of the date of publication, but Santander does not guarantee or represent, express or implied, that such information is accurate or complete. All estimates, forecasts and opinions are current as at the date of this publication and are subject to change without notice. Unless otherwise indicated, Santander does not intend to update this publication. The views and commentary in this publication may not be objective or independent of the interests of the Trading and Sales functions of Santander, who may be active participants in the markets, investments or strategies referred to herein and/or may receive compensation from investment banking and non-investment banking services from entities mentioned herein. Santander may trade as principal, make a market or hold positions in instruments (or related derivatives) and/or hold financial interest in entities discussed herein. Santander may provide market commentary or trading strategies to other clients or engage in transactions which may differ from views expressed herein. Santander may have acted upon the contents of this publication prior to you having received it.
This publication is intended for the exclusive use of the recipient and must not be reproduced, redistributed or transmitted, in whole or in part, without Santander’s consent. The recipient agrees to keep confidential at all times information contained herein.


