


Uncategorized
Eroding TBA drives up spec pool valuations
admin | March 15, 2019
This document is intended for institutional investors and is not subject to all of the independence and disclosure standards applicable to debt research reports prepared for retail investors.
The price premiums on specified pools in MBS have jumped in the last few months thanks to falling potential returns in TBA. Newly issued Fannie Mae and Freddie Mac MBS have shown surprisingly high weighted average coupons, dollar roll financing has looked no better than MBS repo and the arrival of the new uniform MBS market in June should only add to the TBA supply and further erode quality. Much of the specified pool market looks rich with some exceptions: certain geographies and pools backed by investor loans.
Rising weighted average coupons in TBA
Over the last few months, investors have grown increasingly concerned about the spread between the gross WAC and net coupon of newly issued Fannie Mae and Freddie Mac MBS. Originators have found the best execution for loans is to retain excess servicing rather than delivering into a higher coupon MBS pool. Pools with higher WACs have worse convexity than is typical, which drives down the quality of worst-to-deliver pools and reduces the value of the TBA contract.
Investors have increasingly sought protection from higher WACs through specified pools since the investor can stipulate a maximum spread in a specified pool trade. But even if a spec pool carried a higher WAC, the inherent prepayment protection of the collateral would reduce the negative effect on prepayments. The increased demand and lower interest rates have driven pay-ups dramatically.
In June the GSEs, at the direction of the FHFA, are instituting tighter caps on the spread between gross WAC and net coupon as well as the amount of excess servicing an originator can retain. This will improve the quality of future production, but does not protect investors from high spread pools already outstanding or that will be issued prior to June.
Low pay-up stories have fared better
Most specified pools look extremely rich at current pay-ups. However, there remain a few collateral stories that still offer some value.
Exhibit 1 (below) shows actual and theoretical pay-ups for a variety of collateral types. Pay-ups are shown as of the end of 2018 and in the current market. Theoretical pay-ups are calculated by running each pool type at the same OAS as its coupon’s TBA OAS using Yield Book’s production model (v21.4). The analysis was run for 4.0% and 4.5% coupon pools.
Exhibit 1: Most pay-ups are extremely high
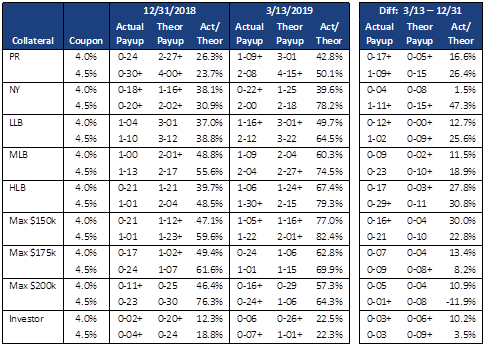
Source: Yield Book, Amherst Pierpont Securities
The ratio of the actual to theoretical pay-up is a useful metric to show whether collateral is overvalued. Since the theoretical pay-up is calculated using the TBA’s OAS it helps normalize for any price action attributable to the TBA. For example, if specified OASs widen but TBA OASs widen more, then the ratio should increase. Many investors use 40% as a rough guide to relative value—collateral trading in excess of roughly that level are considered rich.
At the end of December many common collateral types were trading at or below that threshold. The major exceptions were the higher loan balance buckets, the worst being the 4.5% Max $200k pools trading at 76.3% of the theoretical.
However, by mid-March most collateral is trading in excess of 60% of theoretical. LLB 4.5%s, for example, are currently trading at 64.5% of theoretical, roughly 26% higher than at the end of 2018. Yet a few pockets of value remain where the ratio of actual to theoretical value has changed the least:
- 100% Puerto Rico pools—These loans offer excellent prepayment protection, although prepayments in GSE pools were very high in the aftermath of Hurricane Maria. Investor concern about prepays in the event of another natural disaster is suppressing pay-ups for this collateral.
- 100% New York pools—While New York loans offer very good prepayment protection they also typically prepay slower in a turnover environment. This suppresses pay-ups on lower coupon pools like the 4.0%s, which could be a good investment for someone with a view that rates are going to rally. However pay-ups look very rich on the 4.5%s.
- 100% investment property pools—These loans face very high LLPAs, which elbow shifts the S-Curve towards slower speeds. The S-Curve also tends to be somewhat flatter than generic collateral. The pay-ups are typically very low for these loans, and while they moved relatively higher, both 4.0% and 4.5% pools are still trading at only 22% of theoretical value.
Conclusion
The deteriorating quality of the TBA deliverable and lower interest rates have combined to push pay-ups much higher for many types of specified pools, as many investors seek the better convexity offered by specified pools. The strongest prepayment protection is offered by low loan balance pools, and these pay-ups look very rich at current levels. However, Puerto Rico, New York, and investment property pools are still undervalued compared to Yield Book’s prepayment model and could be a good source of prepayment protection for investors.