Uncategorized
Tracking potential returns to issuing CLO equity
admin | March 8, 2019
This material is a Marketing Communication and does not constitute Independent Investment Research.
A CLO typically builds a portfolio of leveraged loans and finances it with equity and rated debt. The difference between the return on loans and the cost of debt flows to equity. It’s not a true arbitrage as much as a form of spread lending. Estimating potential equity returns can be complex, but a simple benchmark can signal changes to likely CLO demand for leveraged loans and supply of CLO debt and equity. The latest numbers suggest that after the market works off a slight hangover from late 2018, healthy CLO issuance should follow.
The complexity of actual CLO equity returns
The potential profits to CLO equity turn on only a few major cash flows: the returns from loans, the interest paid to debt, the costs of managing the CLO and losses from loan default. Each of these cash flows can vary over time, and the most sophisticated analysis considers a wide range if not all of the possible cash flow combinations. That’s where the complexity starts.
The potential cash flow combinations can seem overwhelming. Portfolio return can vary as the yield curve, credit spreads and other market conditions re-price available leveraged loans and as the manager trades and reinvests the portfolio. Interest paid to debt can vary with market conditions, across managers and as the equity holders exercise options to refinance or reset the debt. And while CLO management costs probably are largely predictable, losses from loan defaults can vary with economic conditions, borrower and collateral quality and loan covenants.
Building a simple benchmark
Despite the complexity, it still helps to have a benchmark of whether potential profits to equity are getting better or worse. A benchmark may not pinpoint potential equity return for any one manager or any one deal, but it can signal trend. That should help the leveraged loan and CLO market anticipate the potential CLO bid for loans and the supply of CLO equity and debt.
As a simple benchmark, Amherst Pierpont has put together a point-in-time estimate of profits to CLO equity with a few components:
- The income from a fully invested portfolio of leveraged loans priced at par with the coupon estimated from the S&P/LSTA 100 index of BB/B loan yields. This assumes a constant spread to the loans’ indices over the life of the deal and that the manager always reinvests at that spread.
- The cost of debt from issuing ‘AAA’ through ‘BB’ tranches at par at spreads indicated by the Palmer Square CLO discount margin indices and using a fixed structure (Exhibit 1). The fixed spreads and fixed structure imply that the manager never refinances or resets the deal.
Exhibit 1: Benchmark CLO structure
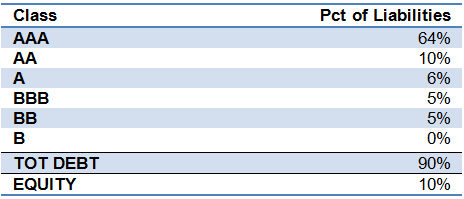
Source: Amherst Pierpont Securities
- Recurring annual operating costs for deal expenses and manager fees for the life of the deal (Exhibit 2).
Exhibit 2: Benchmark annual CLO costs
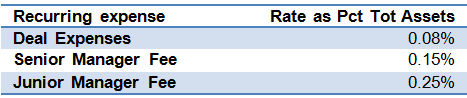
Source: Amherst Pierpont Securities
- Expected losses of interest and ultimate principal from credit assuming a constant 2% annual default rate and a 60% recovery for the life of the deal.
A detailed example of this simple benchmark suggests that the annual yield on par CLO equity as of March 5 is 13.6% and the compounded annual return on equity after estimated losses is 7.6% (Exhibit 3). It’s worth noting that total debt and equity of $458 million exceeds total assets of $450 million in the example to reflect the common practice of paying for initial deal costs out of funds raised and the impact of discounts on debt sold and the price of assets purchased. These numbers are useful for setting a level at a point in time rather than estimating actual expected return.
Exhibit 3: Example of a point-in-time estimate of return on CLO equity
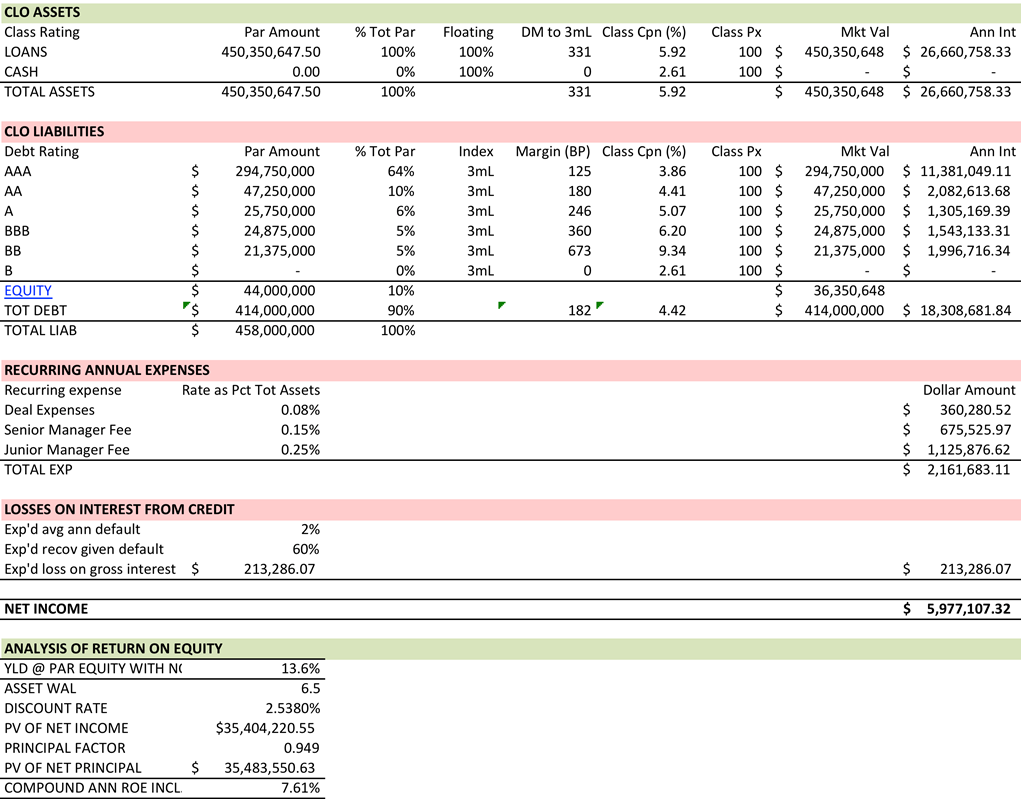
Source: Amherst Pierpont Securities
A time series of benchmark yields and returns on CLO equity
The estimated 13.6% annual yield and 7.6% compounded annual return on equity start to have value when compared against past levels (Exhibit 4). For example, the series of estimates suggests that potential returns to equity started rising in September last year, peaked as spreads on leveraged loans reached their widest point in late December and recently have started to slowly decline. The latest decline reflects spreads on leveraged loans that have tightened much faster than spreads on CLO debt. Since February 1, for example, benchmark spreads on leveraged loans have tightened 17 bp while benchmark ‘AAA’ debt has tightened only 1 bp. The consequently loss of spread to the equity is reflected in the declining benchmark yield and compounded annual return on equity.
Exhibit 4: Recently tighter benchmark yields and returns on CLO equity still exceed most of 2018’s levels
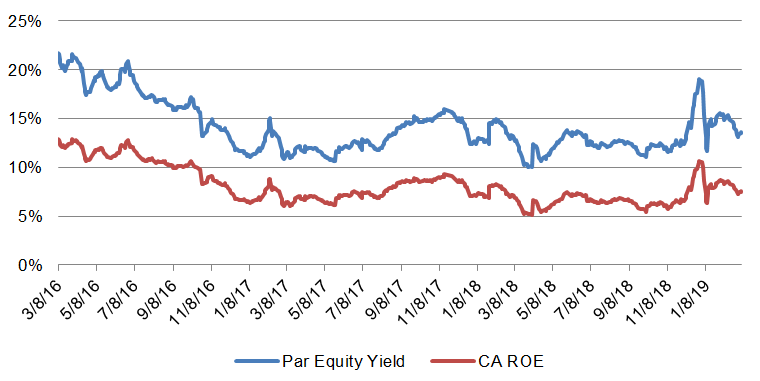
Source: Amherst Pierpont Securities
The series of benchmark yields and returns also suggest, despite the recent decline, that potential profits to equity are still higher than they were at most points last year. Although this year’s $18.3 billion of CLO issuance is down 14.4% from last year at this time, the slow start likely reflects loan warehouses that built up inventory before spreads on loans and debt widened in late 2018. Current wider spreads on debt require creative solutions, which is why some managers recently have brought deals to market with static pools or short reinvestment periods in hopes of pricing short debt at tighter spreads. However, with incentives to equity still better than most points last year, the CLO bid for leveraged loans and the supply of new debt and equity should start tracking last year’s pace in the months ahead.
This material is intended only for institutional investors and does not carry all of the independence and disclosure standards of retail debt research reports. In the preparation of this material, the author may have consulted or otherwise discussed the matters referenced herein with one or more of SCM’s trading desks, any of which may have accumulated or otherwise taken a position, long or short, in any of the financial instruments discussed in or related to this material. Further, SCM may act as a market maker or principal dealer and may have proprietary interests that differ or conflict with the recipient hereof, in connection with any financial instrument discussed in or related to this material.
This message, including any attachments or links contained herein, is subject to important disclaimers, conditions, and disclosures regarding Electronic Communications, which you can find at https://portfolio-strategy.apsec.com/sancap-disclaimers-and-disclosures.
Important Disclaimers
Copyright © 2026 Santander US Capital Markets LLC and its affiliates (“SCM”). All rights reserved. SCM is a member of FINRA and SIPC. This material is intended for limited distribution to institutions only and is not publicly available. Any unauthorized use or disclosure is prohibited.
In making this material available, SCM (i) is not providing any advice to the recipient, including, without limitation, any advice as to investment, legal, accounting, tax and financial matters, (ii) is not acting as an advisor or fiduciary in respect of the recipient, (iii) is not making any predictions or projections and (iv) intends that any recipient to which SCM has provided this material is an “institutional investor” (as defined under applicable law and regulation, including FINRA Rule 4512 and that this material will not be disseminated, in whole or part, to any third party by the recipient.
The author of this material is an economist, desk strategist or trader. In the preparation of this material, the author may have consulted or otherwise discussed the matters referenced herein with one or more of SCM’s trading desks, any of which may have accumulated or otherwise taken a position, long or short, in any of the financial instruments discussed in or related to this material. Further, SCM or any of its affiliates may act as a market maker or principal dealer and may have proprietary interests that differ or conflict with the recipient hereof, in connection with any financial instrument discussed in or related to this material.
This material (i) has been prepared for information purposes only and does not constitute a solicitation or an offer to buy or sell any securities, related investments or other financial instruments, (ii) is neither research, a “research report” as commonly understood under the securities laws and regulations promulgated thereunder nor the product of a research department, (iii) or parts thereof may have been obtained from various sources, the reliability of which has not been verified and cannot be guaranteed by SCM, (iv) should not be reproduced or disclosed to any other person, without SCM’s prior consent and (v) is not intended for distribution in any jurisdiction in which its distribution would be prohibited.
In connection with this material, SCM (i) makes no representation or warranties as to the appropriateness or reliance for use in any transaction or as to the permissibility or legality of any financial instrument in any jurisdiction, (ii) believes the information in this material to be reliable, has not independently verified such information and makes no representation, express or implied, with regard to the accuracy or completeness of such information, (iii) accepts no responsibility or liability as to any reliance placed, or investment decision made, on the basis of such information by the recipient and (iv) does not undertake, and disclaims any duty to undertake, to update or to revise the information contained in this material.
Unless otherwise stated, the views, opinions, forecasts, valuations, or estimates contained in this material are those solely of the author, as of the date of publication of this material, and are subject to change without notice. The recipient of this material should make an independent evaluation of this information and make such other investigations as the recipient considers necessary (including obtaining independent financial advice), before transacting in any financial market or instrument discussed in or related to this material.
Important disclaimers for clients in the EU and UK
This publication has been prepared by Trading Desk Strategists within the Sales and Trading functions of Santander US Capital Markets LLC (“SanCap”), the US registered broker-dealer of Santander Corporate & Investment Banking. This communication is distributed in the EEA by Banco Santander S.A., a credit institution registered in Spain and authorised and regulated by the Bank of Spain and the CNMV. Any EEA recipient of this communication that would like to affect any transaction in any security or issuer discussed herein should do so with Banco Santander S.A. or any of its affiliates (together “Santander”). This communication has been distributed in the UK by Banco Santander, S.A.’s London branch, authorised by the Bank of Spain and subject to regulatory oversight on certain matters by the Financial Conduct Authority (FCA) and the Prudential Regulation Authority (PRA).
The publication is intended for exclusive use for Professional Clients and Eligible Counterparties as defined by MiFID II and is not intended for use by retail customers or for any persons or entities in any jurisdictions or country where such distribution or use would be contrary to local law or regulation.
This material is not a product of Santander´s Research Team and does not constitute independent investment research. This is a marketing communication and may contain ¨investment recommendations¨ as defined by the Market Abuse Regulation 596/2014 ("MAR"). This publication has not been prepared in accordance with legal requirements designed to promote the independence of research and is not subject to any prohibition on dealing ahead of the dissemination of investment research. The author, date and time of the production of this publication are as indicated herein.
This publication does not constitute investment advice and may not be relied upon to form an investment decision, nor should it be construed as any offer to sell or issue or invitation to purchase, acquire or subscribe for any instruments referred herein. The publication has been prepared in good faith and based on information Santander considers reliable as of the date of publication, but Santander does not guarantee or represent, express or implied, that such information is accurate or complete. All estimates, forecasts and opinions are current as at the date of this publication and are subject to change without notice. Unless otherwise indicated, Santander does not intend to update this publication. The views and commentary in this publication may not be objective or independent of the interests of the Trading and Sales functions of Santander, who may be active participants in the markets, investments or strategies referred to herein and/or may receive compensation from investment banking and non-investment banking services from entities mentioned herein. Santander may trade as principal, make a market or hold positions in instruments (or related derivatives) and/or hold financial interest in entities discussed herein. Santander may provide market commentary or trading strategies to other clients or engage in transactions which may differ from views expressed herein. Santander may have acted upon the contents of this publication prior to you having received it.
This publication is intended for the exclusive use of the recipient and must not be reproduced, redistributed or transmitted, in whole or in part, without Santander’s consent. The recipient agrees to keep confidential at all times information contained herein.


