Uncategorized
The impact of construction loans on new Ginnie Mae project loan IO
admin | February 28, 2019
This material is a Marketing Communication and does not constitute Independent Investment Research.
The interest-only tranches of Ginnie Mae project loans usually get the penalties assessed when borrowers voluntarily prepay, and the value of the penalties can overwhelm the lost stream of interest. Loans originated as construction loans have a tendency to prepay faster than more traditional project loans, but construction loans also often come with initial periods that lock out the borrower from prepayment. Faster speeds can help IO value, but lockout can hurt. Analysis of new IOs suggests that lockout hurts more than faster speeds help. There is better value available in IOs with a lower percentage of construction loans.
Lockouts and prepayment penalties
There is a trade-off between the higher prepayment speeds of construction loans, and the fact that these loans are locked-out from prepaying during the construction phase. The lock-out period at loan origination can vary from a few months to four or five years. When the lockout period expires, the loans are subject to prepayment penalties like the other project loans. These penalties are assessed as a specified percentage of the principal amount being prepaid, and the percentage declines over time. A common prepayment penalty scheme is 10% (24) 8%,7%,6%… which means there is a 10% penalty the for the first 24 months, an 8% penalty during the third year, then it declines by 1% each year until it is there is zero prepayment penalty after 10 years.
A brief comparison of two recently issued deals starts to highlight the impact of construction loans (Exhibit 1). Broadly speaking, the two deals have similar collateral characteristics at origination and the IO coupons are 4 bp apart.
Exhibit 1: Collateral comparison of two recently issued IOs
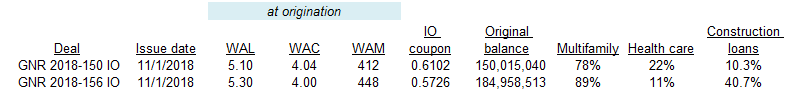
There are two potentially significant differences that could impact IO performance.
- The first is the modest 11% difference in multifamily versus health care loans in the underlying collateral. Health care loans tend to prepay a bit slower and default somewhat more frequently than multifamily loans.
- The second difference is the relatively large 30% difference in the percentage of construction loans at origination. Construction loans are subject to prepay lockout periods. When they exit the lockout period they have a tendency to prepay faster and have a slightly greater default rate.
The collateral backing these two deals is subject to various levels of prepayment penalties over time (Exhibit 2 and Exhibit 3):
- The prepay lockout identifies how the construction loans are rolling out of the lockout period. For the GNR 2018-156 collateral, 30% of the underlying collateral is still in lockout, and the loans with the longest lockouts expire in July of 2020 (Exhibit 2).
- As the lockouts expire, the loans generally transition to the highest level of prepay penalties, where 95% of the collateral is subject to prepay penalties which are greater than or equal to 5% for the next five years (the red line).
- Then the collateral rolls through two declining buckets of prepay penalties, before 80% of the loans has no further prepay penalties in 10 to 12 years from origination, or late-2029.
Exhibit 2: Prepayment penalty profile of GNPL deal with 41% construction loans at origination
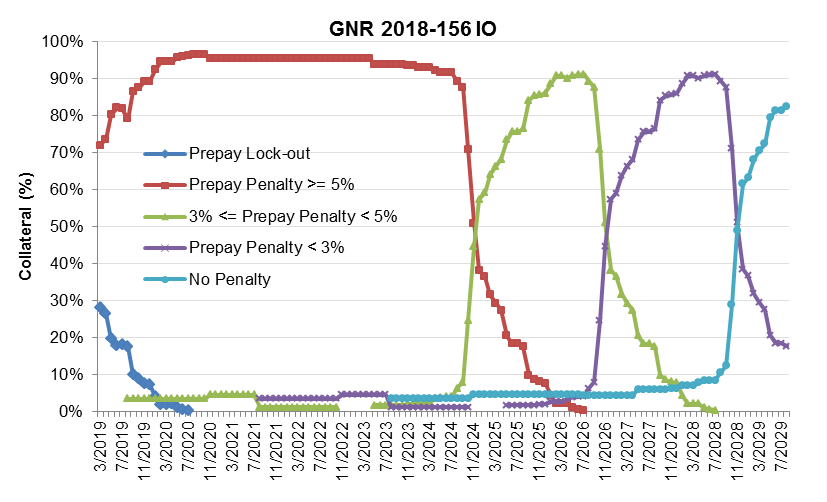
Note: Prepayment profiles as of 2/28/2019. Source: Ginnie Mae, Bloomberg, Amherst Pierpont Securities.
The GNR 2018-150 collateral shows a similar prepay penalty profile, with the only significant difference being the much lower percentage of loans subject to an initial lockout period due to the lower concentration of construction loans.
Exhibit 3: Prepayment penalty profile of GNPL deal with 10% construction loans at origination
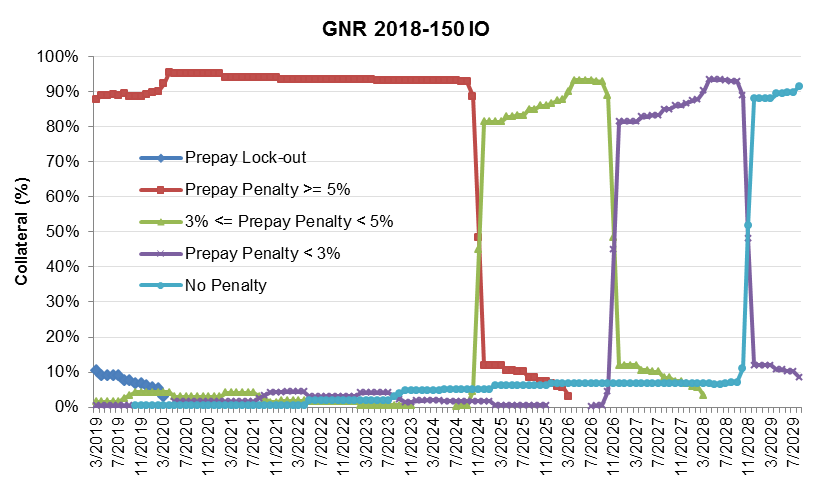
Note: Prepayment profiles as of 2/28/2019. Source: Ginnie Mae, Bloomberg, Amherst Pierpont Securities.
The smaller percentage of initial lockouts means the prepayment penalty profiles progress to each declining phase a bit faster and ultimately reach the no penalty phase earlier, with nearly 90% of loans subject to no penalty by the end of 2028.
Evaluating the OAS across IOs
The Ginnie Mae project loan model takes all of the nuances and discrimination in the collateral and projected performance differences into account when it analyzes the bonds. Most importantly, it helps balance the impact of lockout, prepayment speed and default across collateral. The impact of different exposure to construction loans shows up in recently issued IOs (Exhibit 4).
Exhibit 4: Comparison of recently issued IOs, arranged in order of OAS from widest to tightest
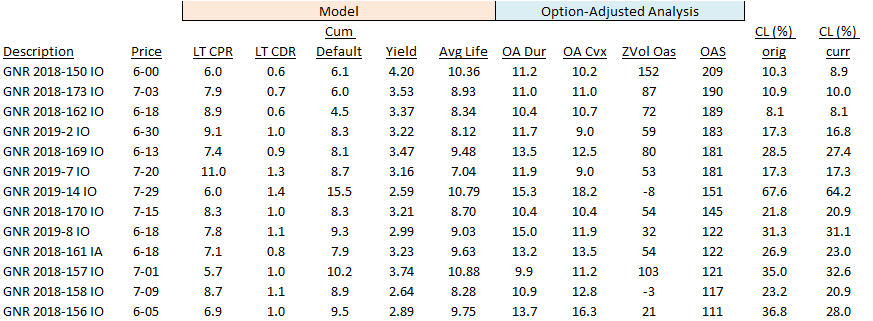
Note: All prices as of 2/20/2019. Source: Ginnie Mae, Amherst Pierpont Securities.
The dispersion in OAS among these Ginnie Mae project loan IOs is nearly 100 bp, with the two structures detailed above representing the widest and tightest OAS in the group. What is also apparent is that the OAS spread declines steadily with the increasing proportion of construction loans (Exhibit 5).
Exhibit 5: Ginnie Mae project loan IOs – OAS vs % of construction loans in collateral
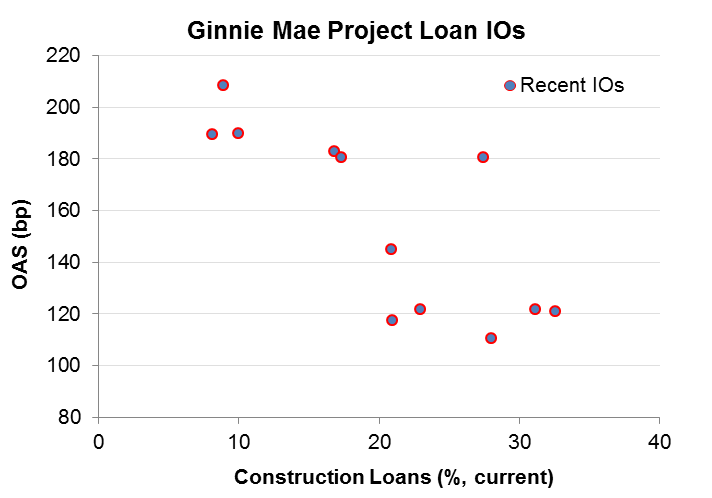
Note: One outlier, GNR 2019-14 IO not shown for clarity. Source: Ginnie Mae, Amherst Pierpont Securities.
The better value across these structures appears to be IOs with lower concentration of construction loans. The opportunity for faster prepayments sooner in pools with lower construction concentrations seems to outweigh the opportunity for faster prepayments later in pools with higher concentrations. That leaves open the possibility that best relative value could switch as construction loan lockout ends. But for investors in project loan IO off of new pools, the best relative value seems to be in lower construction loan exposure.
This material is intended only for institutional investors and does not carry all of the independence and disclosure standards of retail debt research reports. In the preparation of this material, the author may have consulted or otherwise discussed the matters referenced herein with one or more of SCM’s trading desks, any of which may have accumulated or otherwise taken a position, long or short, in any of the financial instruments discussed in or related to this material. Further, SCM may act as a market maker or principal dealer and may have proprietary interests that differ or conflict with the recipient hereof, in connection with any financial instrument discussed in or related to this material.
This message, including any attachments or links contained herein, is subject to important disclaimers, conditions, and disclosures regarding Electronic Communications, which you can find at https://portfolio-strategy.apsec.com/sancap-disclaimers-and-disclosures.
Important Disclaimers
Copyright © 2026 Santander US Capital Markets LLC and its affiliates (“SCM”). All rights reserved. SCM is a member of FINRA and SIPC. This material is intended for limited distribution to institutions only and is not publicly available. Any unauthorized use or disclosure is prohibited.
In making this material available, SCM (i) is not providing any advice to the recipient, including, without limitation, any advice as to investment, legal, accounting, tax and financial matters, (ii) is not acting as an advisor or fiduciary in respect of the recipient, (iii) is not making any predictions or projections and (iv) intends that any recipient to which SCM has provided this material is an “institutional investor” (as defined under applicable law and regulation, including FINRA Rule 4512 and that this material will not be disseminated, in whole or part, to any third party by the recipient.
The author of this material is an economist, desk strategist or trader. In the preparation of this material, the author may have consulted or otherwise discussed the matters referenced herein with one or more of SCM’s trading desks, any of which may have accumulated or otherwise taken a position, long or short, in any of the financial instruments discussed in or related to this material. Further, SCM or any of its affiliates may act as a market maker or principal dealer and may have proprietary interests that differ or conflict with the recipient hereof, in connection with any financial instrument discussed in or related to this material.
This material (i) has been prepared for information purposes only and does not constitute a solicitation or an offer to buy or sell any securities, related investments or other financial instruments, (ii) is neither research, a “research report” as commonly understood under the securities laws and regulations promulgated thereunder nor the product of a research department, (iii) or parts thereof may have been obtained from various sources, the reliability of which has not been verified and cannot be guaranteed by SCM, (iv) should not be reproduced or disclosed to any other person, without SCM’s prior consent and (v) is not intended for distribution in any jurisdiction in which its distribution would be prohibited.
In connection with this material, SCM (i) makes no representation or warranties as to the appropriateness or reliance for use in any transaction or as to the permissibility or legality of any financial instrument in any jurisdiction, (ii) believes the information in this material to be reliable, has not independently verified such information and makes no representation, express or implied, with regard to the accuracy or completeness of such information, (iii) accepts no responsibility or liability as to any reliance placed, or investment decision made, on the basis of such information by the recipient and (iv) does not undertake, and disclaims any duty to undertake, to update or to revise the information contained in this material.
Unless otherwise stated, the views, opinions, forecasts, valuations, or estimates contained in this material are those solely of the author, as of the date of publication of this material, and are subject to change without notice. The recipient of this material should make an independent evaluation of this information and make such other investigations as the recipient considers necessary (including obtaining independent financial advice), before transacting in any financial market or instrument discussed in or related to this material.
Important disclaimers for clients in the EU and UK
This publication has been prepared by Trading Desk Strategists within the Sales and Trading functions of Santander US Capital Markets LLC (“SanCap”), the US registered broker-dealer of Santander Corporate & Investment Banking. This communication is distributed in the EEA by Banco Santander S.A., a credit institution registered in Spain and authorised and regulated by the Bank of Spain and the CNMV. Any EEA recipient of this communication that would like to affect any transaction in any security or issuer discussed herein should do so with Banco Santander S.A. or any of its affiliates (together “Santander”). This communication has been distributed in the UK by Banco Santander, S.A.’s London branch, authorised by the Bank of Spain and subject to regulatory oversight on certain matters by the Financial Conduct Authority (FCA) and the Prudential Regulation Authority (PRA).
The publication is intended for exclusive use for Professional Clients and Eligible Counterparties as defined by MiFID II and is not intended for use by retail customers or for any persons or entities in any jurisdictions or country where such distribution or use would be contrary to local law or regulation.
This material is not a product of Santander´s Research Team and does not constitute independent investment research. This is a marketing communication and may contain ¨investment recommendations¨ as defined by the Market Abuse Regulation 596/2014 ("MAR"). This publication has not been prepared in accordance with legal requirements designed to promote the independence of research and is not subject to any prohibition on dealing ahead of the dissemination of investment research. The author, date and time of the production of this publication are as indicated herein.
This publication does not constitute investment advice and may not be relied upon to form an investment decision, nor should it be construed as any offer to sell or issue or invitation to purchase, acquire or subscribe for any instruments referred herein. The publication has been prepared in good faith and based on information Santander considers reliable as of the date of publication, but Santander does not guarantee or represent, express or implied, that such information is accurate or complete. All estimates, forecasts and opinions are current as at the date of this publication and are subject to change without notice. Unless otherwise indicated, Santander does not intend to update this publication. The views and commentary in this publication may not be objective or independent of the interests of the Trading and Sales functions of Santander, who may be active participants in the markets, investments or strategies referred to herein and/or may receive compensation from investment banking and non-investment banking services from entities mentioned herein. Santander may trade as principal, make a market or hold positions in instruments (or related derivatives) and/or hold financial interest in entities discussed herein. Santander may provide market commentary or trading strategies to other clients or engage in transactions which may differ from views expressed herein. Santander may have acted upon the contents of this publication prior to you having received it.
This publication is intended for the exclusive use of the recipient and must not be reproduced, redistributed or transmitted, in whole or in part, without Santander’s consent. The recipient agrees to keep confidential at all times information contained herein.


