Uncategorized
Forbearance recoveries continue to climb
admin | February 22, 2019
This material is a Marketing Communication and does not constitute Independent Investment Research.
For the first time since we have been tracking forbearance in the legacy market, recoveries on re-performing loans have been 70% or more of the forborne balance in consecutive months. December was a record month for NPL recoveries where liquidated NPLs recovered 67% of their forborne balances.
The level of forbearance recoveries continues to climb, albeit with some noticeable seasonal volatility. Observed recovery rates peaked for non- performing loans in December and January for modified re-performing loans at 67% and 72% respectively. These record recovery rates mark a rebound off seasonally low recovery rates. Over the past three years October or November has marked the lowest monthly recovery rate across both NPLs and RPLs. While this may be attributable to seasonality of home prices, recovery rates do not remain depressed and have historically rebounded significantly in the following month. (Exhibit 1)
Exhibit 1: Forbearance recoveries reach all-time highs after seasonal lows
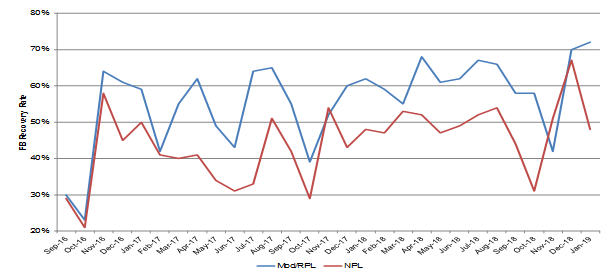
Source: Amherst Insight Labs, Amherst Pierpont Securities
Comparing the profiles of loans that abated in a low recovery month versus a high recovery month shows little difference at least on an average basis. Looking at NPLs that liquidated to a 31% recovery in September of last year to a 31% average recovery versus those that yielded a 67% recovery in December shows that the loans had nearly identical mark-to-market CLTVs at 54 and 55 respectively, comparable loan sizes and percentages of judicial state loans that usually take longer to liquidate with higher severities. One notable difference is that forbearance on the September abatements totaled 42% of the investor balance while it was only 30% of the December loans. Historically, we have observed the lower the amount of forbearance relative to the investor balance, the higher the recovery. (Exhibit 2)
Exhibit 2: Comparing collateral across low and high recovery months
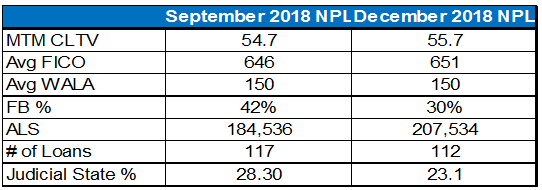
Source: Amherst Insight Labs, Amherst Pierpont Securities
The bigger driver of the disparity is the fact that forbearance recoveries tend to be binary in nature where either all the forbearance is recovered or none of it is. In the October abatements, 37% of the loans recovered at least 90% of their forborne balances at liquidation. In December that number rose to roughly 60%. These types of binary outcomes do not appear to be driven by difference s in risk layering. Comparing the mark-to-market CLTV on the two pools shows that they are nearly identical in terms of the population of higher CLTV loans. Loan that were greater than 80 CLTV made up 5.8% of September liquidations – those loans made up 5.8% of the December NPLs. These types of disparate outcomes despite similar collateral profiles certainly raise questions about whether forgiveness is being misreported as forbearance in some cases. Despite this potential concern, forbearance recoveries continue to increase suggesting that if there is misreported forgiveness it may be a relatively minor issue.
On a forward looking basis, it appears that the opportunity remains sizable and recovery rates should remain relatively elevated. We estimate that there is roughly $42 billion of loans with forbearance totaling nearly $15 billion still outstanding in the legacy market across re-performing and non-performing loans. We project that 82% of those loans will either prepay or pay off in full at maturity, yielding a potential recovery on nearly $12 billion of outstanding forbearance. Outstanding loans with forbearance have an average mark-to-market CLTV of 63 and outstanding forbearance is equivalent to 34% of the investor balance. These numbers are slightly greater than past abatements, which had an average mark-to-market CLTV of 58 and forbearance was equivalent to 28% of the investor balance. Higher forborne amounts and CLTVs on outstanding loans may suggest slightly lower future recovery rates. If home prices continue to rise, recovery rates may remain steady or march higher.
This material is intended only for institutional investors and does not carry all of the independence and disclosure standards of retail debt research reports. In the preparation of this material, the author may have consulted or otherwise discussed the matters referenced herein with one or more of SCM’s trading desks, any of which may have accumulated or otherwise taken a position, long or short, in any of the financial instruments discussed in or related to this material. Further, SCM may act as a market maker or principal dealer and may have proprietary interests that differ or conflict with the recipient hereof, in connection with any financial instrument discussed in or related to this material.
This message, including any attachments or links contained herein, is subject to important disclaimers, conditions, and disclosures regarding Electronic Communications, which you can find at https://portfolio-strategy.apsec.com/sancap-disclaimers-and-disclosures.
Important Disclaimers
Copyright © 2026 Santander US Capital Markets LLC and its affiliates (“SCM”). All rights reserved. SCM is a member of FINRA and SIPC. This material is intended for limited distribution to institutions only and is not publicly available. Any unauthorized use or disclosure is prohibited.
In making this material available, SCM (i) is not providing any advice to the recipient, including, without limitation, any advice as to investment, legal, accounting, tax and financial matters, (ii) is not acting as an advisor or fiduciary in respect of the recipient, (iii) is not making any predictions or projections and (iv) intends that any recipient to which SCM has provided this material is an “institutional investor” (as defined under applicable law and regulation, including FINRA Rule 4512 and that this material will not be disseminated, in whole or part, to any third party by the recipient.
The author of this material is an economist, desk strategist or trader. In the preparation of this material, the author may have consulted or otherwise discussed the matters referenced herein with one or more of SCM’s trading desks, any of which may have accumulated or otherwise taken a position, long or short, in any of the financial instruments discussed in or related to this material. Further, SCM or any of its affiliates may act as a market maker or principal dealer and may have proprietary interests that differ or conflict with the recipient hereof, in connection with any financial instrument discussed in or related to this material.
This material (i) has been prepared for information purposes only and does not constitute a solicitation or an offer to buy or sell any securities, related investments or other financial instruments, (ii) is neither research, a “research report” as commonly understood under the securities laws and regulations promulgated thereunder nor the product of a research department, (iii) or parts thereof may have been obtained from various sources, the reliability of which has not been verified and cannot be guaranteed by SCM, (iv) should not be reproduced or disclosed to any other person, without SCM’s prior consent and (v) is not intended for distribution in any jurisdiction in which its distribution would be prohibited.
In connection with this material, SCM (i) makes no representation or warranties as to the appropriateness or reliance for use in any transaction or as to the permissibility or legality of any financial instrument in any jurisdiction, (ii) believes the information in this material to be reliable, has not independently verified such information and makes no representation, express or implied, with regard to the accuracy or completeness of such information, (iii) accepts no responsibility or liability as to any reliance placed, or investment decision made, on the basis of such information by the recipient and (iv) does not undertake, and disclaims any duty to undertake, to update or to revise the information contained in this material.
Unless otherwise stated, the views, opinions, forecasts, valuations, or estimates contained in this material are those solely of the author, as of the date of publication of this material, and are subject to change without notice. The recipient of this material should make an independent evaluation of this information and make such other investigations as the recipient considers necessary (including obtaining independent financial advice), before transacting in any financial market or instrument discussed in or related to this material.
Important disclaimers for clients in the EU and UK
This publication has been prepared by Trading Desk Strategists within the Sales and Trading functions of Santander US Capital Markets LLC (“SanCap”), the US registered broker-dealer of Santander Corporate & Investment Banking. This communication is distributed in the EEA by Banco Santander S.A., a credit institution registered in Spain and authorised and regulated by the Bank of Spain and the CNMV. Any EEA recipient of this communication that would like to affect any transaction in any security or issuer discussed herein should do so with Banco Santander S.A. or any of its affiliates (together “Santander”). This communication has been distributed in the UK by Banco Santander, S.A.’s London branch, authorised by the Bank of Spain and subject to regulatory oversight on certain matters by the Financial Conduct Authority (FCA) and the Prudential Regulation Authority (PRA).
The publication is intended for exclusive use for Professional Clients and Eligible Counterparties as defined by MiFID II and is not intended for use by retail customers or for any persons or entities in any jurisdictions or country where such distribution or use would be contrary to local law or regulation.
This material is not a product of Santander´s Research Team and does not constitute independent investment research. This is a marketing communication and may contain ¨investment recommendations¨ as defined by the Market Abuse Regulation 596/2014 ("MAR"). This publication has not been prepared in accordance with legal requirements designed to promote the independence of research and is not subject to any prohibition on dealing ahead of the dissemination of investment research. The author, date and time of the production of this publication are as indicated herein.
This publication does not constitute investment advice and may not be relied upon to form an investment decision, nor should it be construed as any offer to sell or issue or invitation to purchase, acquire or subscribe for any instruments referred herein. The publication has been prepared in good faith and based on information Santander considers reliable as of the date of publication, but Santander does not guarantee or represent, express or implied, that such information is accurate or complete. All estimates, forecasts and opinions are current as at the date of this publication and are subject to change without notice. Unless otherwise indicated, Santander does not intend to update this publication. The views and commentary in this publication may not be objective or independent of the interests of the Trading and Sales functions of Santander, who may be active participants in the markets, investments or strategies referred to herein and/or may receive compensation from investment banking and non-investment banking services from entities mentioned herein. Santander may trade as principal, make a market or hold positions in instruments (or related derivatives) and/or hold financial interest in entities discussed herein. Santander may provide market commentary or trading strategies to other clients or engage in transactions which may differ from views expressed herein. Santander may have acted upon the contents of this publication prior to you having received it.
This publication is intended for the exclusive use of the recipient and must not be reproduced, redistributed or transmitted, in whole or in part, without Santander’s consent. The recipient agrees to keep confidential at all times information contained herein.


