Uncategorized
Banking on households
admin | February 22, 2019
This material is a Marketing Communication and does not constitute Independent Investment Research.
Since the first sparks leading to the 2008 financial crisis started on household balance sheets, much of the effort to prevent a repeat has also focused on households. The effort has paid off. By some measures, consumers are better equipped to pay their debts than any time since 1980. And a new Fed paper suggests that households would fare much better than they did the last time if another sharp downturn came around again. Taking credit risk on households continues to look better than the alternatives.
A stronger household balance sheet
A combination of household deleveraging, low interest rates and a tightening labor market have helped drive household debt service payments as a share of disposable personal income down to 9.82%, the lowest level since at least 1980 (Exhibit 1). The deleveraging wasn’t necessarily pretty. Some of it came from mortgage default, some from much tighter lending standards and some from lower consumer demand for debt. Outstanding single-family residential mortgage debt, the biggest liability on the average household balance sheet, dropped by $1.4 trillion between early 2008 and early 2014. And new federal rules requiring lenders to document borrowers’ ability to repay, which went into effect in 2014, has limited the rebound. Low interest rates have allowed a healthy majority of outstanding mortgage borrowers to refinance or take on debt at low rates. And a labor market that has taken unemployment from a crisis peak of 10% to 4% most recently, helping push real median household income toward record levels.
Exhibit 1: Debt service has dropped to a 38-year low as a share of income
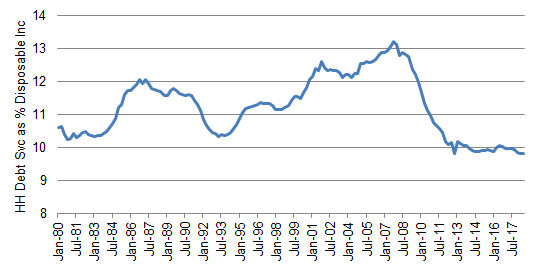
Source: Federal Reserve
The average household asset base has also rebounded from crisis. Homeowners’ equity in real estate, the average household’s largest asset, is up 14.5% from its pre-crisis peak in early 2006. And a 12.8% average annual return on the S&P 500 since the start of 2010 has helped lift pensions, retirement accounts and other investment portfolios.
Exhibit 2: Homeowners’ equity is up 14.5% from its pre-crisis peak
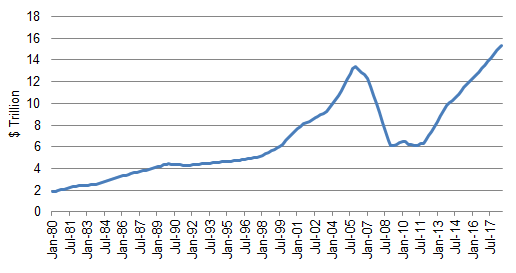
Source: Federal Reserve
Stress testing household balance sheets
A recent study by analysts at the Fed entitled Stress Testing Household Debt applied home price and unemployment shocks from the Comprehensive Capital Analysis Review, or CCAR, to households and found more resiliency than pre-2008. The 2018 CCAR shocks applied to households at the county level showed lower levels of delinquency on debt than observed if the same shocks had occurred to households pre-crisis. A decline in household leverage and a shift in debt towards households with higher credit scores lay behind the better results. A major drop in home prices and a rise in unemployment would still push up delinquency and default, but less than observed after 2008.
Better than alternatives
Household balance sheets look strong not only compared to pre-crisis versions but also compared to the average corporate balance sheet. Corporate leverage has gone up at the same time that household leverage has generally gone down (see, for example, Rising risks from BBBs). Terms on corporate lending have also loosened, with plenty of concern about the risks if companies come under stress (see a recent S&P discussion of leveraged lending here). That’s left corporate credit much more vulnerable to any slowdown in the economy.
Although any drag on growth would affect both household and corporate credit, households seem better prepared to weather the impact. Mortgage credit, multi-family credit, asset-backed credit and other exposures to households broadly look like the better risk-return.
* * *
The view in rates
Very little changes on the rates front week-to-week almost by design. Rates look likely to drift in a narrow band for the foreseeable future. US growth looks likely to slow in 2019, and growth in Europe also looks challenged. With 10-year rates in Germany at 0.09, in Switzerland at -0.35 and Japan at -0.05, the US looks like a relative buy. Foreign flows could pull US rates below neutral.
The view in spreads
With the yield curve flat, rates steady, and those conditions likely to persist, carry matters more to fixed income returns. A stable Fed should keep encouraging carry trades and that should help performance of both corporate debt and MBS. MBS could widen a little this year if new bank liquidity rules reduce bank demand for MBS. Healthy MBS net supply could also weigh on spreads. But low volatility argues for MBS. MBS should still outperform corporate credit. Portfolios buying corporate debt should focus on names that show organic growth or use free cash flow or asset sales to pay down debt.
The view in credit fundamentals
Household balance sheets look strong, and corporate balance sheets look vulnerable. The ratio of household debt service to disposable income is at a record low, corporate leverage at a relative high. Of course, this all can continue for a long time if growth persists. The Fed has signaled that it stands ready to buffer any material softening in growth. Still, corporations may need to trim equity buybacks and reduce debt.
This material is intended only for institutional investors and does not carry all of the independence and disclosure standards of retail debt research reports. In the preparation of this material, the author may have consulted or otherwise discussed the matters referenced herein with one or more of SCM’s trading desks, any of which may have accumulated or otherwise taken a position, long or short, in any of the financial instruments discussed in or related to this material. Further, SCM may act as a market maker or principal dealer and may have proprietary interests that differ or conflict with the recipient hereof, in connection with any financial instrument discussed in or related to this material.
This message, including any attachments or links contained herein, is subject to important disclaimers, conditions, and disclosures regarding Electronic Communications, which you can find at https://portfolio-strategy.apsec.com/sancap-disclaimers-and-disclosures.
Important Disclaimers
Copyright © 2026 Santander US Capital Markets LLC and its affiliates (“SCM”). All rights reserved. SCM is a member of FINRA and SIPC. This material is intended for limited distribution to institutions only and is not publicly available. Any unauthorized use or disclosure is prohibited.
In making this material available, SCM (i) is not providing any advice to the recipient, including, without limitation, any advice as to investment, legal, accounting, tax and financial matters, (ii) is not acting as an advisor or fiduciary in respect of the recipient, (iii) is not making any predictions or projections and (iv) intends that any recipient to which SCM has provided this material is an “institutional investor” (as defined under applicable law and regulation, including FINRA Rule 4512 and that this material will not be disseminated, in whole or part, to any third party by the recipient.
The author of this material is an economist, desk strategist or trader. In the preparation of this material, the author may have consulted or otherwise discussed the matters referenced herein with one or more of SCM’s trading desks, any of which may have accumulated or otherwise taken a position, long or short, in any of the financial instruments discussed in or related to this material. Further, SCM or any of its affiliates may act as a market maker or principal dealer and may have proprietary interests that differ or conflict with the recipient hereof, in connection with any financial instrument discussed in or related to this material.
This material (i) has been prepared for information purposes only and does not constitute a solicitation or an offer to buy or sell any securities, related investments or other financial instruments, (ii) is neither research, a “research report” as commonly understood under the securities laws and regulations promulgated thereunder nor the product of a research department, (iii) or parts thereof may have been obtained from various sources, the reliability of which has not been verified and cannot be guaranteed by SCM, (iv) should not be reproduced or disclosed to any other person, without SCM’s prior consent and (v) is not intended for distribution in any jurisdiction in which its distribution would be prohibited.
In connection with this material, SCM (i) makes no representation or warranties as to the appropriateness or reliance for use in any transaction or as to the permissibility or legality of any financial instrument in any jurisdiction, (ii) believes the information in this material to be reliable, has not independently verified such information and makes no representation, express or implied, with regard to the accuracy or completeness of such information, (iii) accepts no responsibility or liability as to any reliance placed, or investment decision made, on the basis of such information by the recipient and (iv) does not undertake, and disclaims any duty to undertake, to update or to revise the information contained in this material.
Unless otherwise stated, the views, opinions, forecasts, valuations, or estimates contained in this material are those solely of the author, as of the date of publication of this material, and are subject to change without notice. The recipient of this material should make an independent evaluation of this information and make such other investigations as the recipient considers necessary (including obtaining independent financial advice), before transacting in any financial market or instrument discussed in or related to this material.
Important disclaimers for clients in the EU and UK
This publication has been prepared by Trading Desk Strategists within the Sales and Trading functions of Santander US Capital Markets LLC (“SanCap”), the US registered broker-dealer of Santander Corporate & Investment Banking. This communication is distributed in the EEA by Banco Santander S.A., a credit institution registered in Spain and authorised and regulated by the Bank of Spain and the CNMV. Any EEA recipient of this communication that would like to affect any transaction in any security or issuer discussed herein should do so with Banco Santander S.A. or any of its affiliates (together “Santander”). This communication has been distributed in the UK by Banco Santander, S.A.’s London branch, authorised by the Bank of Spain and subject to regulatory oversight on certain matters by the Financial Conduct Authority (FCA) and the Prudential Regulation Authority (PRA).
The publication is intended for exclusive use for Professional Clients and Eligible Counterparties as defined by MiFID II and is not intended for use by retail customers or for any persons or entities in any jurisdictions or country where such distribution or use would be contrary to local law or regulation.
This material is not a product of Santander´s Research Team and does not constitute independent investment research. This is a marketing communication and may contain ¨investment recommendations¨ as defined by the Market Abuse Regulation 596/2014 ("MAR"). This publication has not been prepared in accordance with legal requirements designed to promote the independence of research and is not subject to any prohibition on dealing ahead of the dissemination of investment research. The author, date and time of the production of this publication are as indicated herein.
This publication does not constitute investment advice and may not be relied upon to form an investment decision, nor should it be construed as any offer to sell or issue or invitation to purchase, acquire or subscribe for any instruments referred herein. The publication has been prepared in good faith and based on information Santander considers reliable as of the date of publication, but Santander does not guarantee or represent, express or implied, that such information is accurate or complete. All estimates, forecasts and opinions are current as at the date of this publication and are subject to change without notice. Unless otherwise indicated, Santander does not intend to update this publication. The views and commentary in this publication may not be objective or independent of the interests of the Trading and Sales functions of Santander, who may be active participants in the markets, investments or strategies referred to herein and/or may receive compensation from investment banking and non-investment banking services from entities mentioned herein. Santander may trade as principal, make a market or hold positions in instruments (or related derivatives) and/or hold financial interest in entities discussed herein. Santander may provide market commentary or trading strategies to other clients or engage in transactions which may differ from views expressed herein. Santander may have acted upon the contents of this publication prior to you having received it.
This publication is intended for the exclusive use of the recipient and must not be reproduced, redistributed or transmitted, in whole or in part, without Santander’s consent. The recipient agrees to keep confidential at all times information contained herein.


