


Uncategorized
Prepayments post a 10-year challenge pic
admin | February 8, 2019
This document is intended for institutional investors and is not subject to all of the independence and disclosure standards applicable to debt research reports prepared for retail investors.
Prepayment speeds in 30-year MBS continued their seasonal decline in January, pulled lower by extremely slow housing turnover. Another 2.5 business days in January could not overcome seasonal drag. Lagged interest rates, which get prepayments rolling months before they show up, did fall from December by 25 bp to 30 bp but were still stayed high enough to keep most of the market out-of-the-money for refinancing. Fannie Mae speeds dropped to 6.6 CPR, the slowest print since 2008. Speeds look set to rebound, but only slightly.
A bounce in February and March
Speeds look set to rebound roughly 15% in February and another 20% to 25% in March. Lagged mortgage rates are 15 bp lower and seasonal turnover begins to increase. These factors should push speeds faster in February despite the fact that there are two fewer business days.
Similar to December, discount Ginnie Mae pools did not slow as much as conventional pools and remained generally 2 CPR to 3 CPR faster than conventionals. For example:
- Fannie 30 year 3.5%s 2018 increased 2.2% to 3.8 CPR, while the equivalent Ginnie II cohort increased 1.1% to 6.6 CPR.
- Fannie 30 year 3.0%s 2018 slowed 35.5% to 2.5 CPR, while the equivalent Ginnie II cohort increased 9.8% to 6.1 CPR.
Ginnie Mae 100% Puerto Rico pools also slowed in January. These pools historically offer excellent prepayment protection, but there have been concerns about the potential for fast speeds caused by Hurricane Maria in 2017. Most of the delinquencies resulting from the hurricane have been resolved–and many cured without a buyout—although delinquencies are still slightly elevated relative to the pre-hurricane norm. Slower speeds suggest that buyouts did not increase in January, and might even have fallen; buyout data isn’t available until the evening of the sixth business day.
The Fannie Mae and Freddie Mac numbers
Fannie Mae 30-year aggregate speeds slowed 7.9% to 6.6 CPR from 7.1 CPR, somewhat more than the expected 5% slowdown. Freddie Mac 30-year speeds fell 6.3% to 6.5 CPR from 6.9 CPR, a bit closer to expectations than Fannie’s print. Gold speeds were a little stronger in 3.0%s and 3.5%s
Slower speeds were driven by low seasonal housing turnover, which is usually very low in January. Speeds fell despite 2.5 additional business days and 25 bp to 30 bp lower lagged mortgage rates. Low coupon pools, which primarily prepay due to housing turnover since the loans are out-of-the-money to refi, slowed the most. For example, Fannie Mae 3.0%s slowed 15.4% in aggregate, and most vintages of that coupon slowed comparably.
Exhibit 1: Slower seasonal housing turnover drags speeds down
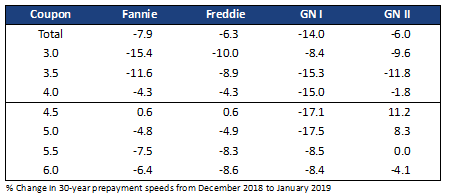
Source: Fannie Mae, Freddie Mac, Ginnie Mae, eMBS, 1010data, Amherst Pierpont Securities
Refinanceability rises but only a little
Lagged mortgage rates fell 25 bp to 30 bp in January and will be another 15 bp lower in February. A cumulative rate move of that magnitude typically would have a large effect on prepayment speeds. But primary rates are so much higher than most mortgages that the majority of the MBS universe remains out-of-the-money (Exhibit 2).
Exhibit 2: Most mortgages are not in-the-money
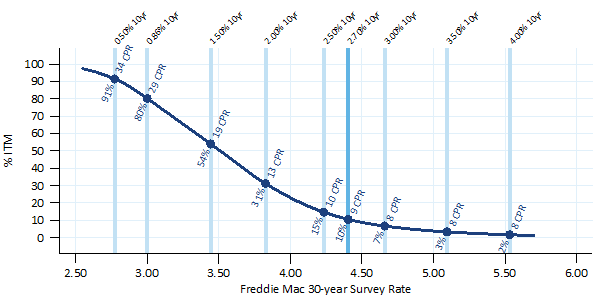
Note: data show the share of outstanding 30-year MBS with 75 bp or more refinancing incentive and also shows the average prepayment speed expected at those rates. The average speed ignores seasonality; actual speeds should be faster in the summer and slower in the winter. Source: Amherst Pierpont Securities.
The MBS universe dropped below 7% in-the-money when Treasury rates exceeded 3.0% and mortgage rates exceeded 4.8%; the subsequent rally pushed refinanceability up to 10%. Even a 2.0% 10-year Treasury rate would only result in 31% of mortgages in-the-money and an aggregate speed of only 13 CPR. However, that only adds roughly 1.0 CPR to average speeds. Certain coupons will react more to the rally than others, of course, but most of the mortgage market will not refinance at these rates.
Looking ahead
Prepayment speeds should rebound by roughly 15% in February and another 20% to 25% in March. Lagged mortgage rates fall another 15 bp and seasonal turnover begins to increase in February, pushing speeds faster despite the fact that there are 2 fewer business days.
Data Tables
Exhibit 3: Prepayment summary

Source: Fannie Mae, Freddie Mac, Ginnie Mae, eMBS, Amherst Pierpont Securities
Our short term forecast is shown in Exhibit 6 (Fannie Mae) and Exhibit 7 (Freddie Mac). Exhibit 5 shows the static rates used in the prepayment forecast.
Exhibit 4: Agency speeds, largest cohorts
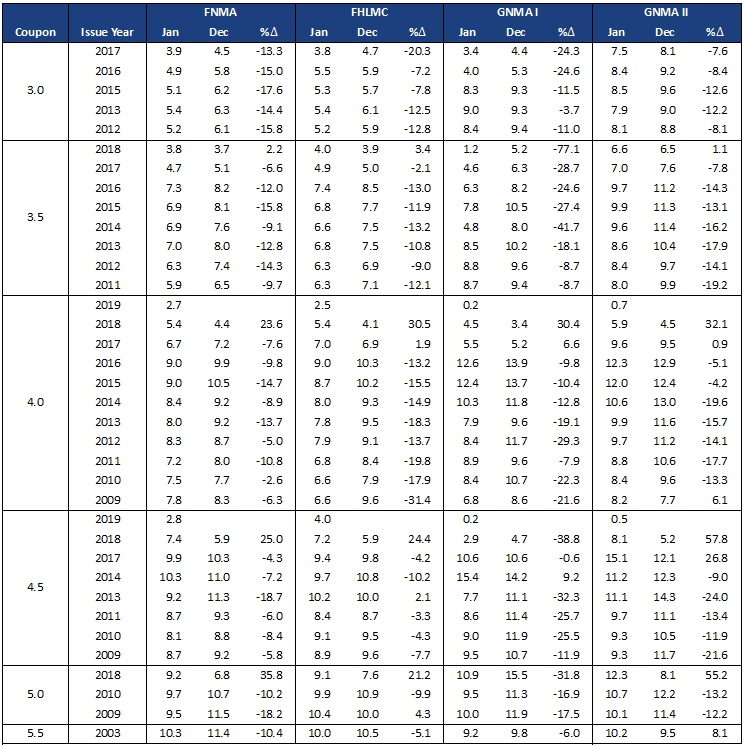
Source: Fannie Mae, Freddie Mac, Ginnie Mae, eMBS, 1010data, Amherst Pierpont Securities
Exhibit 5: Mortgage rate forecast
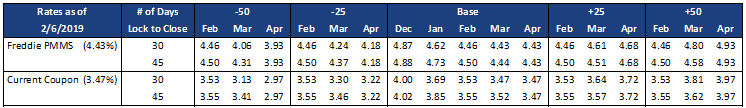
Source: Freddie Mac, Bloomberg, Amherst Pierpont Securities
Exhibit 6: Fannie Mae short term forecast
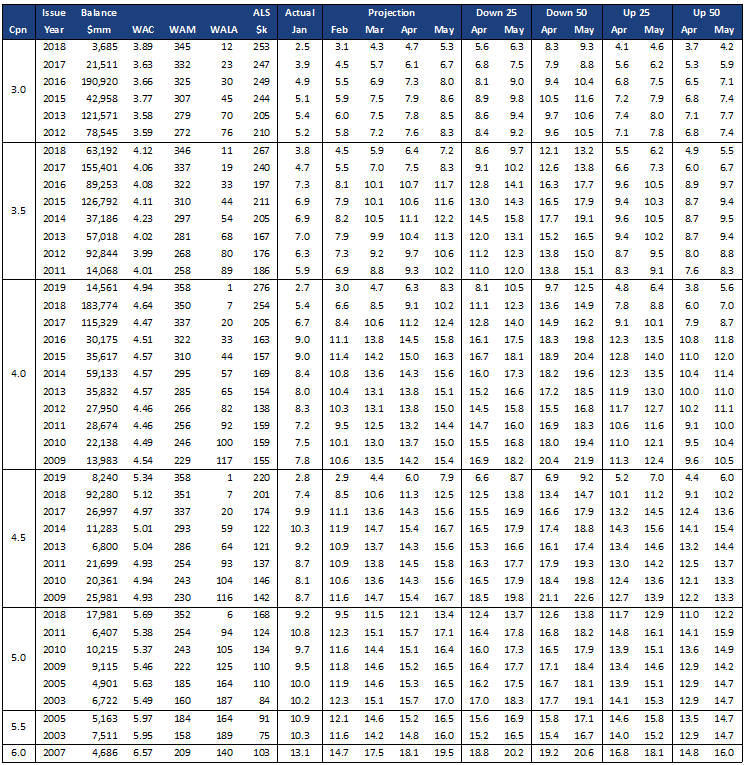
Source: Fannie Mae, eMBS, Amherst Pierpont Securities
Exhibit 7: Freddie Mac short term forecast
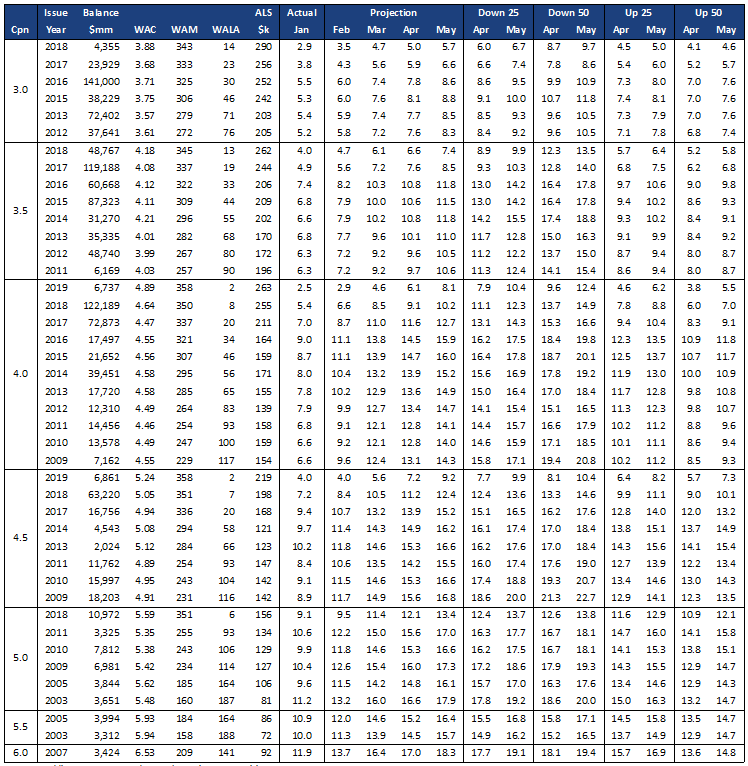
Source: Freddie Mac, eMBS, Amherst Pierpont Securities