Uncategorized
All hands on deck
admin | February 8, 2019
This material is a Marketing Communication and does not constitute Independent Investment Research.
Signs of a tightening labor market continue to pick up with the latest signal coming from labor force participation. Firms held the upper hand over workers for years after 2009 as job candidates outnumbered jobs, but leverage clearly swung to workers last year. Businesses started offering better wages, greater flexibility in work arrangements and became less picky about who they hired. One of the primary signs that firms’ efforts have worked is a remarkable pickup in labor force participation over the past year, as workers have indeed been enticed off of the sidelines by the bidding war from those looking to hire. Wage pressure looks set to continue.
Classic reaction
Economics 101 argues that in any market where demand exceeds supply, prices need to rise to bring the market back into balance. This simple fact explains the puzzling results of 2016 and 2017 when wages failed to pick up more dramatically despite a tightening labor market. In reality, given the low trend rate of productivity growth, the pace of wage growth consistent with a balanced labor market is considerably lower than in past expansions, likely closer to 2% than to 3%. Wage gains of 2.5% to 3.0% were probably consistent with a tightening labor market where workers were gaining bargaining power.
Along came 2018 and a breakout in wage advances. The average hourly earnings gauge posted 3% year-over-year gains, beginning in August, for the first time in nearly a decade, and other hourly pay measures moved higher as well. In fact, the average hourly earnings 12-month increase rose to 3.3% in December, with the corresponding narrower measure incorporating only production and nonsupervisory workers accelerating to 3.5% in December, although both measures came off marginally in January.
Labor force participation rates
The availability of sweeter pay drew hordes of potential workers back into the labor force in 2018. There is a secular downtrend in the aggregate labor force participation rate (LFPR) due to the retirement of massive cohorts of Baby Boomers. The aging of the population impacts the overall LFPR because the Labor Department defines the working-age population as all civilians aged 16 and over, excluding those in the military and prisons. When a higher percentage of the population hits retirement, the overall LFPR goes down.
Given this secular downtrend, the fact that LFPR held roughly steady in 2015, 2016, and 2017 signaled cyclical tightening. The structural downtrend was basically exactly offset by the upward pressure from robust labor demand, drawing people off of the sidelines.
One way to control for the effects of the aging population is to create an age-adjusted LFPR, which holds the weights of the various age groups within the overall population constant. This creates a hypothetical LFPR series under the scenario where the age distribution of the population is constant, thus isolating the cyclical influence (Exhibit 1).
Exhibit 1: Labor force participation rates: actual versus age-constant
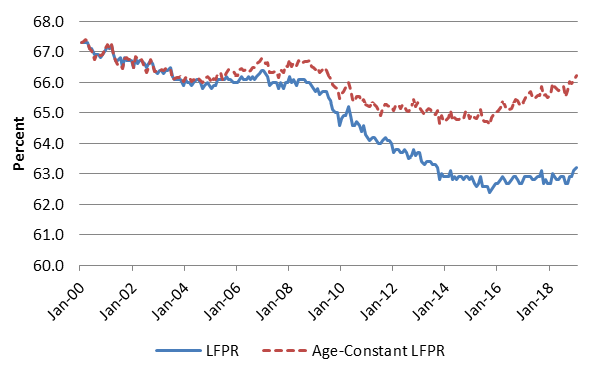
Source: BLS, APS calculations
While the headline LFPR held relatively steady (2015-2017), the age-constant version steadily rose. However, by 2018, the strength of the labor market proved overwhelming. Payroll growth accelerated substantially from 179,000 a month to a stellar 223,000 a month as firms’ demand for workers ratcheted up to match the pickup in the broad economy. The age-constant LFPR surged by three-quarters of percentage point from December 2017 through the latest observation for January to a level not seen in a decade.
Another way to filter out the influence of Baby Boomer retirements is to focus on the prime-age LFPR, which I would define as including ages 25 to 54 (Exhibit 2). This measure has behaved similarly.
Exhibit 2: Prime-age (25-54) labor force participation rate
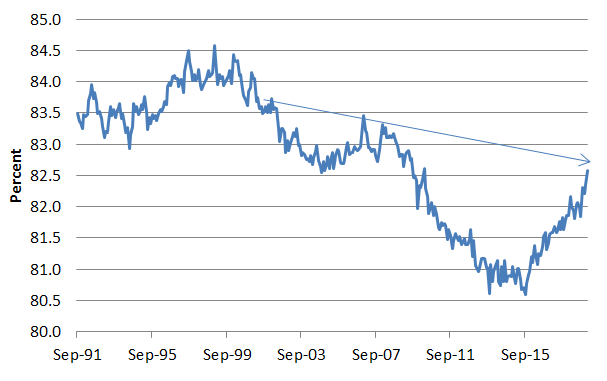
Source: BLS
The prime-age LFPR has also moved up by 0.7 percentage points from December 2017 through January to a level last seen in 2009. Prime-age labor force participation has trended lower over the past 25 years, even aside from cyclical swings, as each cycle has registered lower highs and lower lows. The trend line suggests that the degree of tightness in the labor market may be broadly in line with the top of the 2002-2007 expansion but still perhaps somewhat short of the super-tight labor market of the late-1990s.
How much further can we go?
Every month that labor force growth expands vigorously, optimists herald that it proves that there is more slack in the labor market than previously thought. However, it seems that the opposite is true. There is a finite pool of people who are not currently looking for work but could be drawn into the labor force. Each month that another 300,000 or 400,000 people jump into the labor force, the remaining pool shrinks. Of course, no one knows the size of that pool, so there is no way to be sure about how much room is left to draw in more workers.
In fact, this is not a black-and-white issue that can be settled with an equation. Each individual not currently looking for work has a price. For some, modestly higher wages would be enough to pull them into the workforce. For others such as caregivers of young children and elderly retirees, the price is likely prohibitive. As the labor market tightens, the low-hanging fruit is plucked first. It will almost certainly get tougher for businesses to draw in large numbers of potential employees as they are forced to offer higher and higher wages and friendlier work arrangements to draw in those less inclined to work.
The working-age population is growing at a rate that suggests the pace of job growth consistent with a steady unemployment rate over time is well under 100,000 per month. Thus, even if net hiring slows dramatically in 2019, it will almost certainly still continue to require absorbing a good deal more labor slack.
To provide some numbers, even if employment growth moderates from the stellar 2018 pace to around 175,000 a month—roughly in line with the 2017 clip—the pool of available workers will shrink by about a million, which would require some combination of higher labor force participation and lower unemployment. If the LFPR held constant in 2019, that scenario would likely send the unemployment rate to around 3.25%, which would be the lowest reading since the Korean War and the lowest in peacetime since the 1920s. A modest decline in LFPR, consistent with no cyclical upward pressure to offset the population-driven downtrend, would dictate unemployment of about 3%. Conversely, to keep the unemployment rate roughly steady in the 3.75% vicinity—the rise to 4.0% in January was a 1-month blip driven by the federal government shutdown—the LFPR would have to rise by about half a percentage point on top of 2018’s jump. Either way, as long as labor demand remains robust, firms are going to have to work very hard to staff up in 2019, which means that wage gains are likely to continue accelerating.
This material is intended only for institutional investors and does not carry all of the independence and disclosure standards of retail debt research reports. In the preparation of this material, the author may have consulted or otherwise discussed the matters referenced herein with one or more of SCM’s trading desks, any of which may have accumulated or otherwise taken a position, long or short, in any of the financial instruments discussed in or related to this material. Further, SCM may act as a market maker or principal dealer and may have proprietary interests that differ or conflict with the recipient hereof, in connection with any financial instrument discussed in or related to this material.
This message, including any attachments or links contained herein, is subject to important disclaimers, conditions, and disclosures regarding Electronic Communications, which you can find at https://portfolio-strategy.apsec.com/sancap-disclaimers-and-disclosures.
Important Disclaimers
Copyright © 2026 Santander US Capital Markets LLC and its affiliates (“SCM”). All rights reserved. SCM is a member of FINRA and SIPC. This material is intended for limited distribution to institutions only and is not publicly available. Any unauthorized use or disclosure is prohibited.
In making this material available, SCM (i) is not providing any advice to the recipient, including, without limitation, any advice as to investment, legal, accounting, tax and financial matters, (ii) is not acting as an advisor or fiduciary in respect of the recipient, (iii) is not making any predictions or projections and (iv) intends that any recipient to which SCM has provided this material is an “institutional investor” (as defined under applicable law and regulation, including FINRA Rule 4512 and that this material will not be disseminated, in whole or part, to any third party by the recipient.
The author of this material is an economist, desk strategist or trader. In the preparation of this material, the author may have consulted or otherwise discussed the matters referenced herein with one or more of SCM’s trading desks, any of which may have accumulated or otherwise taken a position, long or short, in any of the financial instruments discussed in or related to this material. Further, SCM or any of its affiliates may act as a market maker or principal dealer and may have proprietary interests that differ or conflict with the recipient hereof, in connection with any financial instrument discussed in or related to this material.
This material (i) has been prepared for information purposes only and does not constitute a solicitation or an offer to buy or sell any securities, related investments or other financial instruments, (ii) is neither research, a “research report” as commonly understood under the securities laws and regulations promulgated thereunder nor the product of a research department, (iii) or parts thereof may have been obtained from various sources, the reliability of which has not been verified and cannot be guaranteed by SCM, (iv) should not be reproduced or disclosed to any other person, without SCM’s prior consent and (v) is not intended for distribution in any jurisdiction in which its distribution would be prohibited.
In connection with this material, SCM (i) makes no representation or warranties as to the appropriateness or reliance for use in any transaction or as to the permissibility or legality of any financial instrument in any jurisdiction, (ii) believes the information in this material to be reliable, has not independently verified such information and makes no representation, express or implied, with regard to the accuracy or completeness of such information, (iii) accepts no responsibility or liability as to any reliance placed, or investment decision made, on the basis of such information by the recipient and (iv) does not undertake, and disclaims any duty to undertake, to update or to revise the information contained in this material.
Unless otherwise stated, the views, opinions, forecasts, valuations, or estimates contained in this material are those solely of the author, as of the date of publication of this material, and are subject to change without notice. The recipient of this material should make an independent evaluation of this information and make such other investigations as the recipient considers necessary (including obtaining independent financial advice), before transacting in any financial market or instrument discussed in or related to this material.
Important disclaimers for clients in the EU and UK
This publication has been prepared by Trading Desk Strategists within the Sales and Trading functions of Santander US Capital Markets LLC (“SanCap”), the US registered broker-dealer of Santander Corporate & Investment Banking. This communication is distributed in the EEA by Banco Santander S.A., a credit institution registered in Spain and authorised and regulated by the Bank of Spain and the CNMV. Any EEA recipient of this communication that would like to affect any transaction in any security or issuer discussed herein should do so with Banco Santander S.A. or any of its affiliates (together “Santander”). This communication has been distributed in the UK by Banco Santander, S.A.’s London branch, authorised by the Bank of Spain and subject to regulatory oversight on certain matters by the Financial Conduct Authority (FCA) and the Prudential Regulation Authority (PRA).
The publication is intended for exclusive use for Professional Clients and Eligible Counterparties as defined by MiFID II and is not intended for use by retail customers or for any persons or entities in any jurisdictions or country where such distribution or use would be contrary to local law or regulation.
This material is not a product of Santander´s Research Team and does not constitute independent investment research. This is a marketing communication and may contain ¨investment recommendations¨ as defined by the Market Abuse Regulation 596/2014 ("MAR"). This publication has not been prepared in accordance with legal requirements designed to promote the independence of research and is not subject to any prohibition on dealing ahead of the dissemination of investment research. The author, date and time of the production of this publication are as indicated herein.
This publication does not constitute investment advice and may not be relied upon to form an investment decision, nor should it be construed as any offer to sell or issue or invitation to purchase, acquire or subscribe for any instruments referred herein. The publication has been prepared in good faith and based on information Santander considers reliable as of the date of publication, but Santander does not guarantee or represent, express or implied, that such information is accurate or complete. All estimates, forecasts and opinions are current as at the date of this publication and are subject to change without notice. Unless otherwise indicated, Santander does not intend to update this publication. The views and commentary in this publication may not be objective or independent of the interests of the Trading and Sales functions of Santander, who may be active participants in the markets, investments or strategies referred to herein and/or may receive compensation from investment banking and non-investment banking services from entities mentioned herein. Santander may trade as principal, make a market or hold positions in instruments (or related derivatives) and/or hold financial interest in entities discussed herein. Santander may provide market commentary or trading strategies to other clients or engage in transactions which may differ from views expressed herein. Santander may have acted upon the contents of this publication prior to you having received it.
This publication is intended for the exclusive use of the recipient and must not be reproduced, redistributed or transmitted, in whole or in part, without Santander’s consent. The recipient agrees to keep confidential at all times information contained herein.


