Uncategorized
A sharp drop in the quality of TBA
admin | February 1, 2019
This material is a Marketing Communication and does not constitute Independent Investment Research.
MBS investors know well that the note rate paid by a borrower is the most important driver of prepayments speeds. Typically there is a relatively stable spread between the weighted average coupon or gross WAC of a pool and the pool’s coupon, but lately that has changed. Fannie Mae and Freddie Mac give originators significant leeway to deliver loans into different coupons, allowing the spread to widen. And widen, it has. The rising gross WAC on new conventional pools has started to erode the quality of the TBA deliverable, and some of the market’s most widely used relative value models have yet to catch up.
The bid for excess servicing is high
Discussions with originators have indicated that the bid for excess servicing is extremely high. If servicing valuations exceed the amount received by selling into a higher coupon then the best execution is delivery into the lower coupon. Originators can deliver loans with a note rate up to 250 bp above the pool’s coupon. Exhibit 1 (below) shows the spread between the gross WAC of the loans and the net coupon of the pool for generic (non-specified) 30-year deliverable pools.
Exhibit 1: Gross/net coupon spreads have widened since April
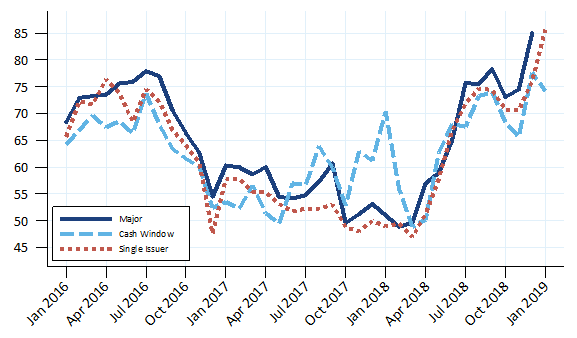
Source: Fannie Mae, Freddie Mac, eMBS, Amherst Pierpont Securities
This spread has widened significantly since April 2018. By July spreads had returned to levels (roughly 75 bp) seen in 2016, and held in that range through the end of October. Starting in November, however, gross/net coupon spreads widened further to roughly 85 bp on average. The most egregious example was deliveries into the 3.5% December Fannie Major pool, which has a spread of 110 bp. These pools will have worse convexity than a typical pool, raising the possibility that even a small amount of production could become TBA worst-to-deliver and lower TBA prices.
While the bid for excess servicing has been very strong, coupon swaps have sold off since the start of November. This is to be expected since interest rates moved significantly lower, but they are priced well below the last time rates were at these levels. For example, the mortgage current coupon averaged 3.52% in January 2019, and the 4.0%/3.5% swap was 64/32s and the 4.5%/4.0% swap was 52/32s. Rates were very similar in February through April 2018, yet the coupon swaps averaged 82/32s and 72/32s, respectively. This has likely contributed to lower coupons becoming best execution for loans.
The GSEs are participating, too
Exhibit 1 (above) shows the gross/net coupon spread for three different pool types:
- Single issuer pools
- Multi-issuer “major” pools (borrowing Fannie Mae’s name)
- Multi-issuer cash window pools
The cash window pools are especially interesting, since Fannie Mae and Freddie Mac make the pooling decisions. In a cash window sale the originator can retain at most 50 bp of servicing, so the fact that spreads on cash window pools have tracked wider alongside the major and single issuer pools—in these cases, the originator picks the coupon and retains the excess—shows that the GSEs have chosen to profit from the strong bid for excess servicing, possibly to the detriment of the overall MBS market. Although it is worth mentioning that neither GSE sold a 3.5% cash window pool in December.
The problem is this hurts the TBA deliverable
The TBA price has to reflect the valuation of the worst-to-deliver pool, so the creation of these high gross WAC pools should push down TBA prices. YieldBook has not yet updated its TBA assumptions, and its gross/net coupon spreads are roughly 60 bp to 65 bp. That is roughly 20 bp lower than current levels. Exhibit 2 (below) shows that adjusting gross WACs 20 bp higher should lower the TBA price by 5.6/32s for 3.5%s, 7.9/32s for 4.0%s, and 8.6/32s for the 4.5%s.
Exhibit 2: Higher gross WAC should hurt TBA prices (as of 1/30/2019)
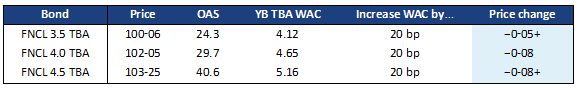
Source: Yield Book, Amherst Pierpont Securities
Some of this should manifest itself in higher pay-ups for a variety of more seasoned pools that have lower gross/net coupon spreads. However, many investors look at pay-ups as a percent of theoretical value, so the actual pay-up increase will be less than the theoretical value. For example, take a pool with a 20/32 theoretical pay-up and 8/32 actual pay-up. If the TBA drops by 6/32s then the new theoretical pay-up would be 26/32s, but the new actual pay-up would be , a 2.4/32 increase. Therefore the entire market suffers if the TBA deliverable worsens.
Ginnie Mae MBS do not suffer this problem
Ginnie Mae does not offer the same leeway to servicers that the GSEs provide. Within the Ginnie Mae II program the gross/net coupon spread must be between 25 bp and 75 bp (the older Ginnie Mae I program requires the spread to be 50 bp exactly). This means that originators have no option to deliver a loan into a different coupon. Therefore, any spread variation is small from month-to-month and depends only on the mix of loans being originated in a given month.
This material is intended only for institutional investors and does not carry all of the independence and disclosure standards of retail debt research reports. In the preparation of this material, the author may have consulted or otherwise discussed the matters referenced herein with one or more of SCM’s trading desks, any of which may have accumulated or otherwise taken a position, long or short, in any of the financial instruments discussed in or related to this material. Further, SCM may act as a market maker or principal dealer and may have proprietary interests that differ or conflict with the recipient hereof, in connection with any financial instrument discussed in or related to this material.
This message, including any attachments or links contained herein, is subject to important disclaimers, conditions, and disclosures regarding Electronic Communications, which you can find at https://portfolio-strategy.apsec.com/sancap-disclaimers-and-disclosures.
Important Disclaimers
Copyright © 2026 Santander US Capital Markets LLC and its affiliates (“SCM”). All rights reserved. SCM is a member of FINRA and SIPC. This material is intended for limited distribution to institutions only and is not publicly available. Any unauthorized use or disclosure is prohibited.
In making this material available, SCM (i) is not providing any advice to the recipient, including, without limitation, any advice as to investment, legal, accounting, tax and financial matters, (ii) is not acting as an advisor or fiduciary in respect of the recipient, (iii) is not making any predictions or projections and (iv) intends that any recipient to which SCM has provided this material is an “institutional investor” (as defined under applicable law and regulation, including FINRA Rule 4512 and that this material will not be disseminated, in whole or part, to any third party by the recipient.
The author of this material is an economist, desk strategist or trader. In the preparation of this material, the author may have consulted or otherwise discussed the matters referenced herein with one or more of SCM’s trading desks, any of which may have accumulated or otherwise taken a position, long or short, in any of the financial instruments discussed in or related to this material. Further, SCM or any of its affiliates may act as a market maker or principal dealer and may have proprietary interests that differ or conflict with the recipient hereof, in connection with any financial instrument discussed in or related to this material.
This material (i) has been prepared for information purposes only and does not constitute a solicitation or an offer to buy or sell any securities, related investments or other financial instruments, (ii) is neither research, a “research report” as commonly understood under the securities laws and regulations promulgated thereunder nor the product of a research department, (iii) or parts thereof may have been obtained from various sources, the reliability of which has not been verified and cannot be guaranteed by SCM, (iv) should not be reproduced or disclosed to any other person, without SCM’s prior consent and (v) is not intended for distribution in any jurisdiction in which its distribution would be prohibited.
In connection with this material, SCM (i) makes no representation or warranties as to the appropriateness or reliance for use in any transaction or as to the permissibility or legality of any financial instrument in any jurisdiction, (ii) believes the information in this material to be reliable, has not independently verified such information and makes no representation, express or implied, with regard to the accuracy or completeness of such information, (iii) accepts no responsibility or liability as to any reliance placed, or investment decision made, on the basis of such information by the recipient and (iv) does not undertake, and disclaims any duty to undertake, to update or to revise the information contained in this material.
Unless otherwise stated, the views, opinions, forecasts, valuations, or estimates contained in this material are those solely of the author, as of the date of publication of this material, and are subject to change without notice. The recipient of this material should make an independent evaluation of this information and make such other investigations as the recipient considers necessary (including obtaining independent financial advice), before transacting in any financial market or instrument discussed in or related to this material.
Important disclaimers for clients in the EU and UK
This publication has been prepared by Trading Desk Strategists within the Sales and Trading functions of Santander US Capital Markets LLC (“SanCap”), the US registered broker-dealer of Santander Corporate & Investment Banking. This communication is distributed in the EEA by Banco Santander S.A., a credit institution registered in Spain and authorised and regulated by the Bank of Spain and the CNMV. Any EEA recipient of this communication that would like to affect any transaction in any security or issuer discussed herein should do so with Banco Santander S.A. or any of its affiliates (together “Santander”). This communication has been distributed in the UK by Banco Santander, S.A.’s London branch, authorised by the Bank of Spain and subject to regulatory oversight on certain matters by the Financial Conduct Authority (FCA) and the Prudential Regulation Authority (PRA).
The publication is intended for exclusive use for Professional Clients and Eligible Counterparties as defined by MiFID II and is not intended for use by retail customers or for any persons or entities in any jurisdictions or country where such distribution or use would be contrary to local law or regulation.
This material is not a product of Santander´s Research Team and does not constitute independent investment research. This is a marketing communication and may contain ¨investment recommendations¨ as defined by the Market Abuse Regulation 596/2014 ("MAR"). This publication has not been prepared in accordance with legal requirements designed to promote the independence of research and is not subject to any prohibition on dealing ahead of the dissemination of investment research. The author, date and time of the production of this publication are as indicated herein.
This publication does not constitute investment advice and may not be relied upon to form an investment decision, nor should it be construed as any offer to sell or issue or invitation to purchase, acquire or subscribe for any instruments referred herein. The publication has been prepared in good faith and based on information Santander considers reliable as of the date of publication, but Santander does not guarantee or represent, express or implied, that such information is accurate or complete. All estimates, forecasts and opinions are current as at the date of this publication and are subject to change without notice. Unless otherwise indicated, Santander does not intend to update this publication. The views and commentary in this publication may not be objective or independent of the interests of the Trading and Sales functions of Santander, who may be active participants in the markets, investments or strategies referred to herein and/or may receive compensation from investment banking and non-investment banking services from entities mentioned herein. Santander may trade as principal, make a market or hold positions in instruments (or related derivatives) and/or hold financial interest in entities discussed herein. Santander may provide market commentary or trading strategies to other clients or engage in transactions which may differ from views expressed herein. Santander may have acted upon the contents of this publication prior to you having received it.
This publication is intended for the exclusive use of the recipient and must not be reproduced, redistributed or transmitted, in whole or in part, without Santander’s consent. The recipient agrees to keep confidential at all times information contained herein.


