Uncategorized
Prepayments, defaults and value in Ginnie Mae project loans
admin | January 22, 2019
This material is a Marketing Communication and does not constitute Independent Investment Research.
Ginnie Mae project loans and structured transactions backed by them conventionally get priced and valued based on a single projection of prepayments and defaults, but actual cash flows can vary dramatically. Voluntary prepayments on outstanding project loans in recent years have varied from 40 CPR to less than 5 CPR (Exhibit 1). With the project loan market growing from $40.6 billion in at the end of 2008 to $116.7 billion today, more portfolios have exposure to these cash flows. Some market participants have developed basic models of project loan prepayments and defaults, but the extent and quality of information on these risks has improved substantially in recent years. Using detailed information on each loan to model these cash flows highlights the potential impact:
- Projected speeds differ substantially from one deal to another
- Estimated duration and convexity differ substantially across and within deals
- Option-adjusted spreads and other measures of relative value vary substantially as well
Exhibit 1: Voluntary prepayments on Ginnie Mae project loans have varied significantly in the last decade
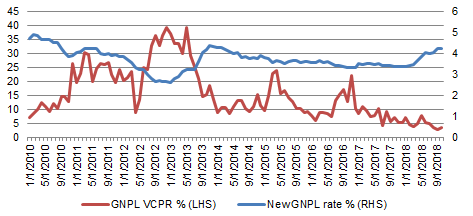
Source: Amherst Pierpont Securities
A handful of important loan features end up driving prepayments, defaults and potential value in Ginnie Mae project loans. Prepayments naturally rely mainly on the opportunities and obstacles to lowering the borrower’s interest rate, and defaults on the passage of time and the changing value of each property. But understanding the difference between these types of early repayment becomes important in Ginnie Mae project loans. Even through the full faith and credit of the US government guarantees investors against principal loss from default, defaults do not generate the penalty fees that usually come with voluntary prepayments and flow to certain classes of structured transactions. The classes that receive prepayments penalties are leveraged on the difference between voluntary prepayment and default.
* * *
Major influences on prepayments
Interest rates
Shifting interest rates naturally have the greatest impact on project loan prepayments. As rates change, borrowers have changing incentives to either refinance their loan or stay in their existing one. Loans with interest rates right at current market levels with average prepayment penalties historically prepay around 20 CPR (Exhibit 2). If primary market rates drop 50 bp, speeds have moved up to 35 CPR, and at a drop of 100 bp speeds approach 45 CPR. If primary rates rise, borrowers lose pure rate incentives to refinance. Borrowers might still choose to refinance and take out a larger loan to extract accumulated equity from a property, but higher rates impose a cost for extracting equity. Extraction of equity slows. Outright sales of mortgaged properties slow as well, lowering loan prepayments. When market rates have exceeded borrowers’ rates by 50 bp, for instance, speeds on the average outstanding loan have slowed toward 5-7 CPR.
Exhibit 2: Voluntary prepayment speeds shift with refinancing incentives
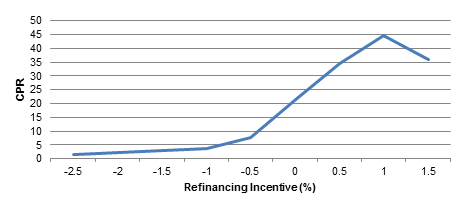
Note: data reflect voluntary prepayments from January 2014, after introduction of streamlined refinancing through the Interest Rate Reduction Program, through August 2018. Refinancing incentive is measured as WAC – Primary GNPL Rate 2-months Prior, adjusted for penalty points, for all loans that have any prepayment lockout period. Source: Amherst Pierpont Securities.
Prepayment lockout and penalties
Almost all project loans have some form of prepayment protection that combines a possible initial lockout period, where the borrower cannot prepay, with a schedule of subsequent prepayment penalties. The lockout and penalty schedule can vary from loan to loan (Exhibit 3). The dominant form of protection in recent years, noted as 0:10-1, involves no lockout and a penalty schedule that starts at 10% of principal balance in the first year and steps down by 1% every year thereafter. The second most common, 0:10,10,10,7-1,involves no lockout, a 10% penalty for the first three years and then a penalty that starts at 7% of principal balance in the fourth year and steps down by 1% every year thereafter. The third most common, 0:10,10,8-1, also involves no lockout, a 10% penalty for two years, and an 8% penalty in the third year than steps down by 1% every year thereafter. Other structures make up the balance.
Exhibit 3: Lockout and prepayment penalty structures have varied over time
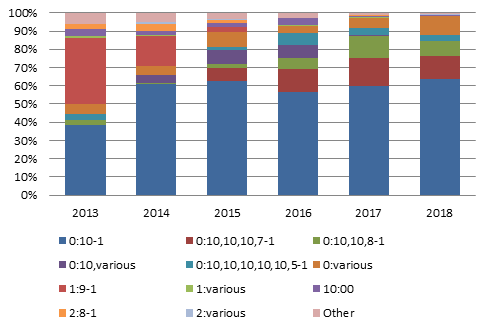
Note: Notation shows (Lockout):(Penalty Schedule). For example, 0:10-1 indicates zero years of lockout followed by annual penalties that start at 10% of principal balance and declines 1% annually. 0:10,10,10,7-1 indicates zero years of lockout followed by three years of 10% and penalties in remaining years that decline from 7% to 1%. Source: Amherst Pierpont Securities
Lockout prevents any voluntary prepayments but can create pent up demand to refinance when the lockout expires. In the first few months after a loan’s lockout ends—assuming some incentive to refinance, take out equity or sell the property—prepayments can run at twice the pace predicted by incentive and other factors (Exhibit 4). Twelve month later, however, speeds typically return to predicted levels.
Exhibit 4: Prepayments can rise sharply after lockout ends but return to baseline within 12 months
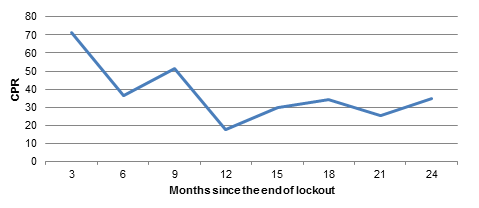
Note: data reflect voluntary prepayments from January 2014, after introduction of streamlined refinancing through the Interest Rate Reduction Program, through August 2018. Source: Amherst Pierpont Securities
Annual project loan penalties reduce but do not eliminate the tendency of a borrower to respond to refinancing incentives, the impact rising with the number of penalty points (Exhibit 5). Penalty points effectively flatten loan refinancing incentives. A loan with 100 basis points of refinancing incentive, for instance, historically has refinanced at around 45 CPR. A loan with the same incentive but a 7% penalty has refinanced at around 30 CPR. With a 9% penalty, refinancing historically drops below 20% CPR.
Exhibit 5: Prepayment penalties dampen the response to refinancing incentives
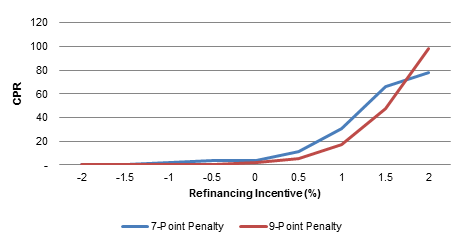
Note: data reflect voluntary prepayments from January 2014, after introduction of streamlined refinancing through the Interest Rate Reduction Program, through August 2018. Source: Amherst Pierpont Securities
The Federal Housing Administration can override lockout and prepayment penalties in the best interest of the government. In cases where a borrower is under stress and able to refinance, FHA might prefer to waive the penalty and let the borrower refinance to keep the property out of default.
Loan size
After interest rates and lockout and penalties, loan size has the next most important effect. Larger project loans generally refinance faster than smaller loans for any given rate incentive because larger loans capture a stream of higher absolute savings. This helps larger loans pay for any fixed costs of refinancing. At a refinancing incentive of 50 bp, for example, a loan with a $5 million balance might prepay around 20 CPR while a loan with a $15 million balance might prepay around 40 CPR.
Exhibit 6: Larger loans prepay faster for any refinancing incentive: impact of loan size on CPR with a 50 bp incentive
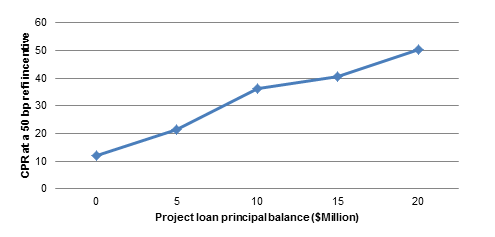
Note: data reflect voluntary prepayments from January 2014, after introduction of streamlined refinancing through the Interest Rate Reduction Program, through August 2018. Source: Amherst Pierpont Securities
Price appreciation
Loans with more price appreciation prepay faster at any given rate incentive. Property owners with mark-to-market profits often qualify easily for refinancing and often choose to take out equity or sell the property (Exhibit 7). Borrowers can use profits from property sale or proceeds from taking out equity to pay any prepayment penalties. If interest rates rise, a buyer of the property could choose to assume the loan and its below-market rate. But significant appreciation means the loan covers a smaller share of the property’s market value, requiring a new buyer to put in more equity. Despite a low rate on the existing loan, the buyer often chooses to take out a larger loan and contribute a small amount of equity. Property owners with mark-to-market losses often show low or no voluntary prepayments, likely because the owners would have to put more equity into the property to qualify for refinancing. A loan with 50 bp of refinancing incentive and 15% property appreciation might prepay at 20 CPR while one with 15% depreciation might prepay well below 5 CPR.
Exhibit 7: Loans with more appreciation prepay faster for any refinancing incentive: impact of price appreciation on CPR for a 50 bp refi incentive
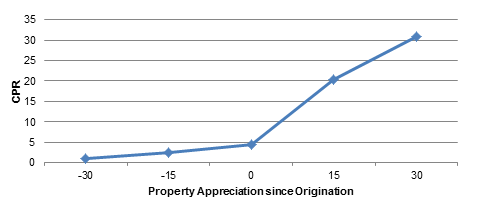
Note: data reflect property price and voluntary prepayments from January 2006 through August 2018. Source: Amherst Pierpont Securities
Other influences on prepayments
Age
Older loans prepay faster than newer loans. That partly reflects the evolution of the property owner’s business over time as well as changes in interest rates and property values. But even with all else equal, a 12-month old loan should prepay at only 65% of the pace of a 36-month old loan. Beyond 36 months, age has little added effect.
Loan purpose
The purpose of the project loan can significantly affect speeds, particularly the difference between a loan initially used to build a project and a loan made against a completed project. Construction loan certificates fund the construction of a property and then convert to project loans on completion. The borrower only pays interest during the construction phase, and starts paying principal when the loan converts. Other borrowers take out loans against completed projects or refinance existing project loans. Construction loans that convert into project loans prepay much faster than other types (Exhibit 8). At 100 bp of refinancing incentive, a typical converted project loan historically has prepaid around 70 CPR while other types have prepaid between 20 CPR and 30 CPR.
Exhibit 8: Construction loans that convert to project loans prepay quickly for any refinancing incentive
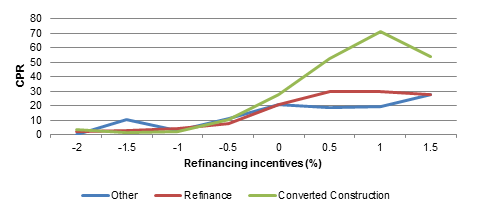
Note: data reflect voluntary prepayments from January 2014, after introduction of streamlined refinancing through the Interest Rate Reduction Program, through August 2018. Source: Amherst Pierpont Securities
Property type
FHA lends money against three major types of property: hospitals, other health care properties such as assisted living or nursing home, multifamily, and, through the US Department of Agriculture Rural Development program, rural rental or Section 538 housing. Rural housing loans historically prepay much more slowly than others presumably because streamlined refinancing available through FHA to other borrowers was not available through USDA (Exhibit 9). With 100 bp of refinancing incentive, for example, rural housing loans prepay around 10 CPR while healthcare and multifamily loans range between 30 CPR and 50 CPR. However, the USDA has recently extended streamlined financing to rural rental housing, so this prepayment difference may shrink or disappear.
Exhibit 9: Loans against rural rental housing prepay more slowly than other property types
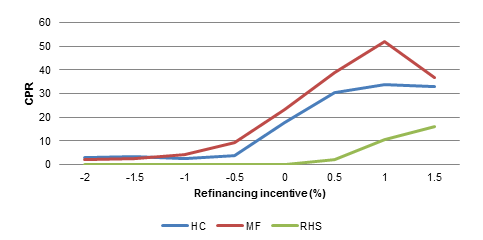
Note: data reflect voluntary prepayments from January 2014, after introduction of streamlined refinancing through the Interest Rate Reduction Program, through August 2018. Source: Amherst Pierpont Securities
Low income housing tax credit or LIHTC
Project loans also finance housing that qualifies for low income housing tax credits, or LIHTC. These properties have units where residents earn 60% or less of the local median income at the time they move in. The typical property qualifying for LIHTC tends to prepay at roughly 70% of the pace of properties without LIHTC (Exhibit 10). The slower speeds reflects the risk that refinancing a property with LIHTC might force the borrower to forfeit the tax credit and repay a substantial portion or even all of prior credits. This obviously raises the cost of refinancing.
Exhibit 10: Properties qualifying for a low income housing tax credit show slower speeds
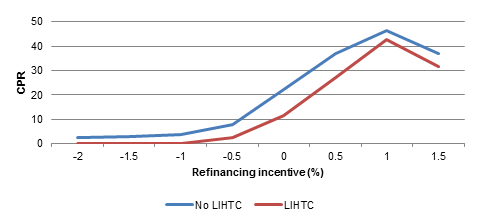
Note: data reflect voluntary prepayments from January 2014, after introduction of streamlined refinancing through the Interest Rate Reduction Program, through August 2018. Source: Amherst Pierpont Securities
Burnout
Some borrowers continue to pass up opportunities to refinance for reasons that might not be captured in features of the loan, property appreciation or other measures. The more opportunity missed, the lower the likelihood the borrower will refinance at the next opportunity. This accumulation of refinancing incentives missed, or burnout, dampens the borrower response to refinancing incentives over time.
Influences on prepayments beyond the loan itself
Although the unique properties of each project loan have the most influence on voluntary prepayments, a few aspects of the FHA program itself have shifted prepayment risk over time.
Mortgage Insurance Premium, or MIP
Project loans have guarantees from the Federal Housing Administration, or FHA, and from Ginnie Mae, and the mortgage insurance premium paid by borrowers for these guarantees can change over time. The borrower pays an upfront and an annual premium. The upfront premium currently ranges from 25 basis points to 100 basis points, and the annual premium from 25 basis points to 95 basis points. More importantly, the MIP schedule can change from year to year, shifting incentives to refinance. Borrowers financing multifamily properties also can get MIPs reduced by raising the amount of low income housing tax credit awarded to the property or by improving the building’s energy efficiency. Tracking loans’ current MIP and comparing them to potential new MIP schedules is essential for measuring refinancing incentives.
The interest rate reduction program
Since April 2013, the US Department of Housing and Urban Development, which includes FHA, has offered streamlined refinancing for existing guaranteed multifamily loans. The program has a couple of key features:
- The new loan has to have the same balance and remaining term, ruling out cash-out refinancing
- The MIP has to stay the same
- Fees include only nominal items such as legal fees, title, recording and GNMA fees and excluded more substantial items such as financing fees, placement fees, HUD application fees and so on
- The program offers faster processing
This has a few effects on project loan prepayments:
- The program lowers the cost to refinance, encouraging borrowers to respond to smaller rate incentives. Financing and placement fees currently can range from $40,000 on loans of less than $2 million to as much as 3.5% of the principal balance on some larger loans.
- The program lowers the risk from MIP changes since it requires the borrower to keep the same premium
- Borrowers respond to shifting rates faster since the process is easier, and
- The program lowers the barrier for smaller loans to refinance
* * *
Major influences on defaults
Project loan defaults do not pose credit risk to investors because the combined FHA and Ginnie Mae guarantees put the full faith and credit of the United States behind the timely payment of principal and interest. However, defaults generate early return of principal and, in addition, borrowers that default do not pay prepayment penalties. Any class of a project loan securitization that receives prepayments penalties is particularly sensitive to defaults.
Project loans typically default when the borrower no longer can make payments and the net proceeds from selling the property would not cover the outstanding balance. Some borrowers still hesitate to default out of concern about their reputation or out of expectation that cash flow or property value might rebound. Nevertheless, a few factors track default rates in project loans.
Age
Project loan defaults rise with age as the business model of the owner and the value of the property evolve. Defaults move up slowly in the first 18 months since the business and the property value are unlikely to vary dramatically immediately after underwriting (Exhibit X). The pace accelerates afterwards to peak around 40 months and decline to a plateau. The tendency to peak and decline parallels other real estate assets where rising property value tends to lower defaults, given enough time.
Exhibit 11: Project loan defaults rise to a peak then decline with loan age
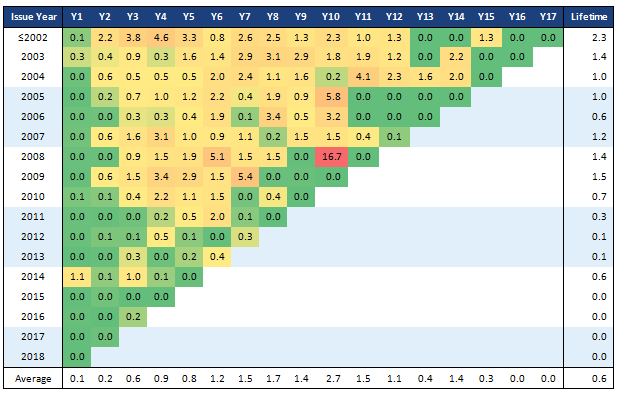
Note: The sizable default in the 2008 vintage in Year 10 reflects CUSIP 36296R7D3, a $72 million loan that prepaid during its lockout period. The analysis assumes HUD waived the lockout requirement to avoid a costly default. Source: Amherst Pierpont Securities
Price appreciation
A rise or fall in the value of the financed property can significantly shift default risk. Appreciation of as little as 10% historically has reduced defaults by 20%, for example, while depreciation of 10% has raised defaults by 40%. Tracking price appreciation is critical to understanding project loan default.
Loan size
Defaults tend to rise with loan size, all else equal. A $15 million loan tends to default at more than twice the rate as a $5 million loan. Size likely reflects differences in property operators and their decision-making. Larger loans tend to go to larger operators more willing to put a property into default if market value drops below loan balance. Smaller loans go to smaller operators less open to strategic default.
Other influences on defaults
Loan purpose
Construction loans that convert into project loans, along with other types of loans, default at a much higher rate than refinanced project loans (Exhibit 12). The refinanced loans arguably have had time to test the owner’s business model and for the property to appreciate. The record suggests significantly lower default risk.
Exhibit 12: Refinanced loans historically default at a relatively low rate
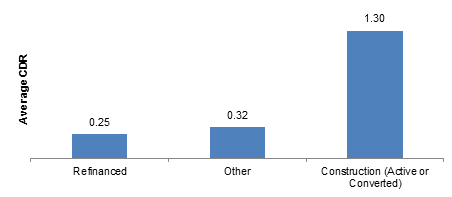
Source: Amherst Pierpont Securities
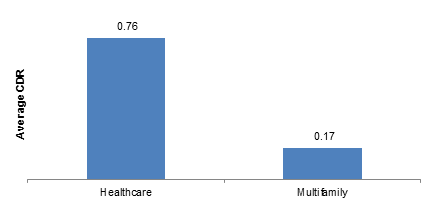
Property type
Healthcare facilities and hospitals default at a much higher rate than multifamily properties (Exhibit 13). The ability of a local market to support healthcare or hospitals historically looks much more volatile than support for affordable housing.
Exhibit 13: Multifamily loans historically default at a relatively low rate
Source: Amherst Pierpont Securities
The impact of prepayments and defaults on project loan valuation
The most effective use of any project loan cash flow model is for measuring relative value within the project loan market. Measuring across asset classes— comparing project loans to agency MBS, for instance—runs the risk that differences in the amount and quality of data across the markets creates material differences in the quality of the models themselves, and that clouds the comparison. Within a market, however, a model allows simple comparison with a single yardstick.
Analysis of recent Ginnie Mae project loan structures highlights relative value across different classes (Exhibit 14). A few observations:
- Across every structure and every class, the projected combination of voluntary prepayments and defaults is slower than the 15 CPJ pricing assumption, although all of these structures trade below par and the underlying loans have limited incentives to refinance. The result is a longer projected average life and, since all classes trade at a discount, a lower yield.
- Across each structure, classes with longer average lives tend to have higher option-adjusted spreads, something also commonly observed in agency MBS structures. Investors can interpret the higher OAS either as higher expected spread or as a premium for the risk that prepayment and default behavior may change over longer periods.
- In structures that have an interest-only or IO class, the IO class typically has the higher option-adjusted spread. Investors again can interpret the higher OAS either as higher expected return, a risk premium or a reflection of a more narrow audience and lower liquidity for IO.
The analysis also highlights relative value across different structures. A few examples:
- Each structure includes a class with an average life around three years at 15 CPJ, but the average lives projected by the model differ substantially. GNR 2018-161 AC shows the smallest difference between CPJ and model estimates of average life leading to the best model yield among these shorter classes, the lowest model duration and best OAS.
- Several structures include IO classes such as GNR 2018-161 IA, GNR 2018-136 IO, GNR 2018-56 IO and GNR 2018-41 IO. Prepayments, defaults and price all heavily influence the IO valuations. Lower prepayments can both increase IO interest cash flow and reduce payment of penalties to the class, lower defaults ensure more prepayment penalties go to the IO class and lower price improves likely return. GNR 2018-56 IO shows the slowest projected prepayment rate, the lowest projected defaults and trades at the lowest price, a combination leading to an OAS of 282—the highest across these IO.
Exhibit 14: Model analysis highlights relative value within and across structures
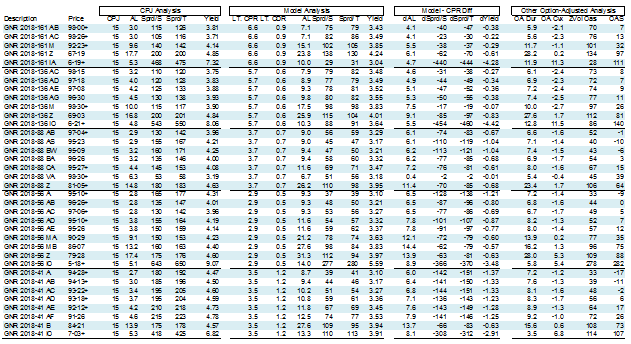
Note: All market levels as of 1/9/19 market close. All model and option-adjusted analysis assumes forward LIBOR rates. Long-term CPRs and CDRs are calculated as the single speed that matches the weighted average life projected by the model. Source: Amherst Pierpont Securities.
* * *
The Ginnie Mae project loan market has reached a size and maturity that warrants detailed analysis of loan cash flows and how the value of those cash flows get shaped by structure. The cash flows vary significantly as features of the loan, the borrower and the market change. Value varies, too, creating new opportunity for analysis that identifies the better investments.