Uncategorized
Collateral trends in the new non-agency
admin | January 18, 2019
This material is a Marketing Communication and does not constitute Independent Investment Research.
The new private label market is not only growing, it is evolving. An analysis of different shelves over time shows even within a given issuer’s program, the composition of collateral can change fairly meaningfully. Not surprisingly, shelves the market considers prime tend to show a relatively stable collateral profile. The others, not so much.
While it seems the new non-agency market has a myriad of euphemisms to describe loans that are being securitized, the reality is they are distinguished by a few things: their loan credit quality, their loan size and eligibility for agency MBS securitization, and by features that determine if the loan is a Qualifying Mortgage. These criteria help filter the current universe of new non-agency loans into a handful of categories, and those categories help distinguish the most active non-agency MBS issuers from each other. While the market often brands a deal, shelf or issuer as simply ‘prime’ or ‘non-QM’ the reality is that the new non-agency is rarely homogeneous and that investors may be exposed to multiple different types of loans in a single transaction. Given this, we offer an alternative to these often inaccurate monikers.
The universe of new non-agency loans falls into a handful of categories[1]:
- Prime agency conforming
- Prime jumbo agency conforming
- Prime jumbo non-agency
- Prime non-QM
- Non-prime non-QM
Applying this taxonomy allows us to compare shelves within a given market convention like prime or non-QM as well as observe how deals within a given shelf might be changing over time. Starting with prime shelves the major noticeable trend is the pronounced increase in jumbo conforming loans being securitized in private label deals. However this phenomenon is far more pronounced in JP Morgan’s JPMMT shelf than in Redwood’s SEMT shelf. (Exhibit 1)
Exhibit 1: Loan level taxonomy across prime major shelves
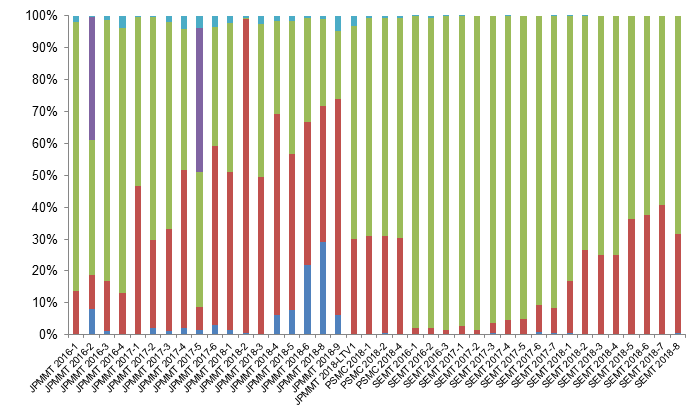
Source: Amherst Insight Labs, Amherst Pierpont
The JPMMT shelf is also seeing a growing concentration of conforming balance loans being securitized – a phenomenon completely absent from Redwood securitizations. Additionally, based on this taxonomy, it appears there is modestly greater risk layering in the JPMMT shelf where non-prime loans, which we define as below a 700 FICO, non-QM loans make up nearly 5% of the pool in some more recent transactions.
Turning to expanded prime, we look at the Flagstar, Galton and Redwood’s ‘CHoice’ program. Looking across the three shelves illustrates how different shelves that are characterized by the same broad designation can be. While all three shelves contain a meaningful amount of prime jumbo non-conforming loans, those percentages can range anywhere from 16% to 75% even within a given shelf. Flagstar’s FSMT shelf appears to have the most diverse collateral mix of the three issuers. The Flagstar program is really more of a hybrid program, securitizing everything from hyper-prime jumbo loans to 100% investor pools. Flagstar stands out from other issuers given their large and steady population of conforming balance loans in their deals. They also have the smallest, albeit growing, population of non-prime non-QM loans. Looking at collateral trends across the other issuers, the population of prime non-QM loans in Galton’s GFMT shelf has grown steadily over time as the population of non-prime loans has decreased, an apparent credit positive. The population of non-prime non-QM loans has decreased in Redwood’s SEMT CH shelf as well, with those loans being replaced by a combination of agency conforming and jumbo conforming loans. (Exhibit 2)
Exhibit 2: Loan level taxonomy across major expanded prime shelves
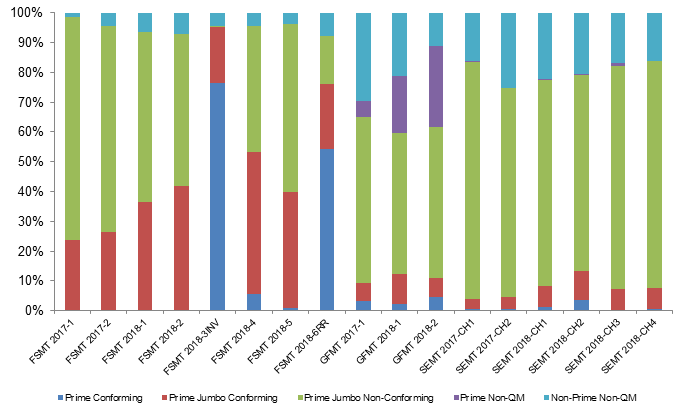
Source: Amherst Insight Labs, Amherst Pierpont
Looking at non-QM issuers shows that label to be a pretty stark misnomer albeit in varying degrees. The population of non-prime, non-QM trusts tends to vary substantially across issuers and trusts with the population of those loans decreasing across some issuers and increasing across others over time. One caveat to this is that the taxonomy is derived from Loan Performance data and this data is unavailable for certain later 2018 vintage transactions, making it more difficult to ascertain the more recent trajectory of collateral trends across affected shelves.
One shelf where we do have a complete picture of collateral trends is Angel Oak’s AOMT shelf. Over time the population of non-prime, non-QM loans has steadily decreased, generally being replaced by higher balance prime loans. This trend should be a credit positive for later vintage Angel Oak deals, although given the deleveraging and benign credit performance of earlier vintage deals this change may only be modestly impactful. Caliber’s COLT shelf tends to have fairly limited variability in the composition of its collateral over the life of issuance. Non-prime, non-QM loans tend to vary somewhat and increased into the latter half of 2018. Those loans made up roughly 45% of the issuer’s 2016-3 transaction and 60% of their 2018-3 deal. The increase in non-prime, non-QM loans has been at the expense of smaller concentrations of prime conforming and jumbo conforming loans. Both the Angel Oak and Caliber shelves contain smaller populations of the Deephaven and Verus non-QM shelves which are generally marked by consistently larger populations of non-prime loans.
[1] For a detailed description of the taxonomy see APS Portfolio Strategy: The emerging non-agency MBS market landscape, September 21, 2018
This material is intended only for institutional investors and does not carry all of the independence and disclosure standards of retail debt research reports. In the preparation of this material, the author may have consulted or otherwise discussed the matters referenced herein with one or more of SCM’s trading desks, any of which may have accumulated or otherwise taken a position, long or short, in any of the financial instruments discussed in or related to this material. Further, SCM may act as a market maker or principal dealer and may have proprietary interests that differ or conflict with the recipient hereof, in connection with any financial instrument discussed in or related to this material.
This message, including any attachments or links contained herein, is subject to important disclaimers, conditions, and disclosures regarding Electronic Communications, which you can find at https://portfolio-strategy.apsec.com/sancap-disclaimers-and-disclosures.
Important Disclaimers
Copyright © 2026 Santander US Capital Markets LLC and its affiliates (“SCM”). All rights reserved. SCM is a member of FINRA and SIPC. This material is intended for limited distribution to institutions only and is not publicly available. Any unauthorized use or disclosure is prohibited.
In making this material available, SCM (i) is not providing any advice to the recipient, including, without limitation, any advice as to investment, legal, accounting, tax and financial matters, (ii) is not acting as an advisor or fiduciary in respect of the recipient, (iii) is not making any predictions or projections and (iv) intends that any recipient to which SCM has provided this material is an “institutional investor” (as defined under applicable law and regulation, including FINRA Rule 4512 and that this material will not be disseminated, in whole or part, to any third party by the recipient.
The author of this material is an economist, desk strategist or trader. In the preparation of this material, the author may have consulted or otherwise discussed the matters referenced herein with one or more of SCM’s trading desks, any of which may have accumulated or otherwise taken a position, long or short, in any of the financial instruments discussed in or related to this material. Further, SCM or any of its affiliates may act as a market maker or principal dealer and may have proprietary interests that differ or conflict with the recipient hereof, in connection with any financial instrument discussed in or related to this material.
This material (i) has been prepared for information purposes only and does not constitute a solicitation or an offer to buy or sell any securities, related investments or other financial instruments, (ii) is neither research, a “research report” as commonly understood under the securities laws and regulations promulgated thereunder nor the product of a research department, (iii) or parts thereof may have been obtained from various sources, the reliability of which has not been verified and cannot be guaranteed by SCM, (iv) should not be reproduced or disclosed to any other person, without SCM’s prior consent and (v) is not intended for distribution in any jurisdiction in which its distribution would be prohibited.
In connection with this material, SCM (i) makes no representation or warranties as to the appropriateness or reliance for use in any transaction or as to the permissibility or legality of any financial instrument in any jurisdiction, (ii) believes the information in this material to be reliable, has not independently verified such information and makes no representation, express or implied, with regard to the accuracy or completeness of such information, (iii) accepts no responsibility or liability as to any reliance placed, or investment decision made, on the basis of such information by the recipient and (iv) does not undertake, and disclaims any duty to undertake, to update or to revise the information contained in this material.
Unless otherwise stated, the views, opinions, forecasts, valuations, or estimates contained in this material are those solely of the author, as of the date of publication of this material, and are subject to change without notice. The recipient of this material should make an independent evaluation of this information and make such other investigations as the recipient considers necessary (including obtaining independent financial advice), before transacting in any financial market or instrument discussed in or related to this material.
Important disclaimers for clients in the EU and UK
This publication has been prepared by Trading Desk Strategists within the Sales and Trading functions of Santander US Capital Markets LLC (“SanCap”), the US registered broker-dealer of Santander Corporate & Investment Banking. This communication is distributed in the EEA by Banco Santander S.A., a credit institution registered in Spain and authorised and regulated by the Bank of Spain and the CNMV. Any EEA recipient of this communication that would like to affect any transaction in any security or issuer discussed herein should do so with Banco Santander S.A. or any of its affiliates (together “Santander”). This communication has been distributed in the UK by Banco Santander, S.A.’s London branch, authorised by the Bank of Spain and subject to regulatory oversight on certain matters by the Financial Conduct Authority (FCA) and the Prudential Regulation Authority (PRA).
The publication is intended for exclusive use for Professional Clients and Eligible Counterparties as defined by MiFID II and is not intended for use by retail customers or for any persons or entities in any jurisdictions or country where such distribution or use would be contrary to local law or regulation.
This material is not a product of Santander´s Research Team and does not constitute independent investment research. This is a marketing communication and may contain ¨investment recommendations¨ as defined by the Market Abuse Regulation 596/2014 ("MAR"). This publication has not been prepared in accordance with legal requirements designed to promote the independence of research and is not subject to any prohibition on dealing ahead of the dissemination of investment research. The author, date and time of the production of this publication are as indicated herein.
This publication does not constitute investment advice and may not be relied upon to form an investment decision, nor should it be construed as any offer to sell or issue or invitation to purchase, acquire or subscribe for any instruments referred herein. The publication has been prepared in good faith and based on information Santander considers reliable as of the date of publication, but Santander does not guarantee or represent, express or implied, that such information is accurate or complete. All estimates, forecasts and opinions are current as at the date of this publication and are subject to change without notice. Unless otherwise indicated, Santander does not intend to update this publication. The views and commentary in this publication may not be objective or independent of the interests of the Trading and Sales functions of Santander, who may be active participants in the markets, investments or strategies referred to herein and/or may receive compensation from investment banking and non-investment banking services from entities mentioned herein. Santander may trade as principal, make a market or hold positions in instruments (or related derivatives) and/or hold financial interest in entities discussed herein. Santander may provide market commentary or trading strategies to other clients or engage in transactions which may differ from views expressed herein. Santander may have acted upon the contents of this publication prior to you having received it.
This publication is intended for the exclusive use of the recipient and must not be reproduced, redistributed or transmitted, in whole or in part, without Santander’s consent. The recipient agrees to keep confidential at all times information contained herein.


