Uncategorized
A simple model of CLO spread-per-turn-of-leverage
admin | January 18, 2019
This material is a Marketing Communication and does not constitute Independent Investment Research.
Even though nominal spreads on all CLO debt tend to widen as leveraged loan prices fall, not all classes feel the pain equally. Lower-rated and more leveraged classes take the brunt, with the market demanding spread for every rising turn of leverage. But after accounting for leverage, the more subtle influence of other factors becomes clearer. CLO price, callability and reinvestment window, among other things, step to the fore.
Just another day in the CLO markets
The market seems to demand surprisingly consistent spread-per-turn-of-leverage, or SPTL, in CLO classes over time (Measuring relative value through spread-per-turn-of-leverage), but it also seems to demand consistent spread across different offerings at a given point in time. A given day’s offerings across and within CLO rating categories can show a wide nominal range but a limited range of spread-per-turn-of-leverage. At least 47 CLO debt classes from ‘AAA’ to ‘BB’ showed up in the market on January 15, for instance, with indicated nominal discount margins ranging from 111 bp to 744 bp. But SPTL across these offerings only ranged from 26 bp to 49 bp.
Exhibit 1: A wide range of nominal spreads, a narrow range of spread-per-turn-of-leverage
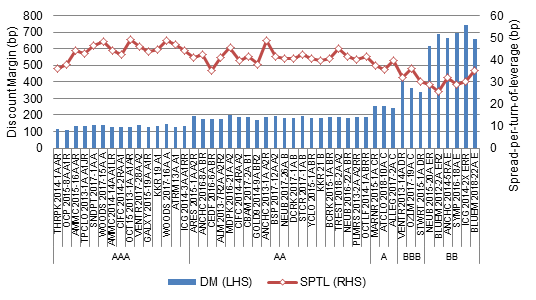
Source: APS
The tendency for SPTL to explain a large part of the range in nominal spread across and within rating categories immediately raises the possibility that it evens the playing field for finding relative value across CLO debt. Before drawing that conclusion, however, it’s worth seeing if some of the differences in SPTL reflect other features of a CLO offering—like time-to-first-call-date and time-to-last-reinvestment-date.
Tighter spreads for longer non-call periods
The time to a CLO’s first call date should influence spreads – both nominal and SPTL. The time-to-first-call signals how long an investor potentially has hold onto a premium coupon before the equity class exercises its call option, refinances or restructures the debt. That’s the option the debt investor writes to the equity class, struck at the discount margin at new issue. The shorter the non-call period, the more valuable the equity holder’s option and the more yield premium or spread the CLO debt investor should get. Focusing just on the largest category of CLOs in the market on January 15, the ‘AA’ classes, SPTL declines a few basis points as the non-call period available across securities gets longer (Exhibit 2).
Exhibit 2: Even in a 1-day snapshot, SPTL for secondary ‘AA’ securities rises slightly as the CLO non-call period gets shorter
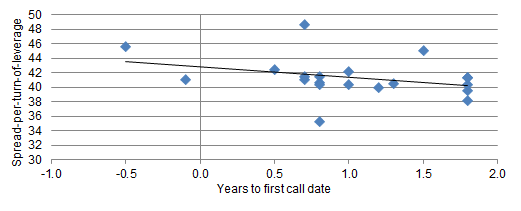
Note: data show SPTL on 1/15/19 for secondard ‘AA’ CLO classes. Source: APS
Wider spreads for longer reinvestment periods
The time to last reinvestment date also should matter, at least for today’s par-to-discount securities, because the CLO has more spread duration and, consequently, should offer more compensation. Again for the ‘AA’ classes in the market on January 15, that’s the case. Spreads widen slightly for every year remaining in reinvestment (Exhibit 3).
Exhibit 3: SPTL across ‘AA’ securities rises slightly as reinvestment period gets longer
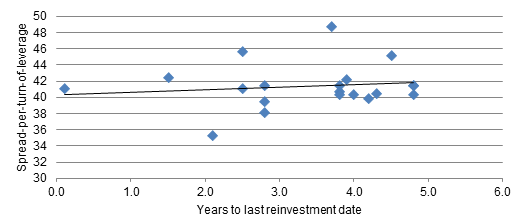
Note: data show SPTL on 1/15/19 for secondary ‘AA’ CLO classes. Source: APS
Measuring the impact in basis points
Any single day’s trading activity is not a reliable guide to the market over time, but it does put to the test the idea that the market incorporates these factors into its bid. A simple regression across the ‘AA’ secondary flows shows that for every additional year of non-call protection, SPTL declines by 3.0 bp. For every additional year before the end of reinvestment, SPTL rises by 1.3 bp. (Exhibit 4). And both effects are statistically significant.
Exhibit 4: Regressing SPTL on Years-to-first-call and Years-to-last-reinvestment indicates both significantly affect spreads
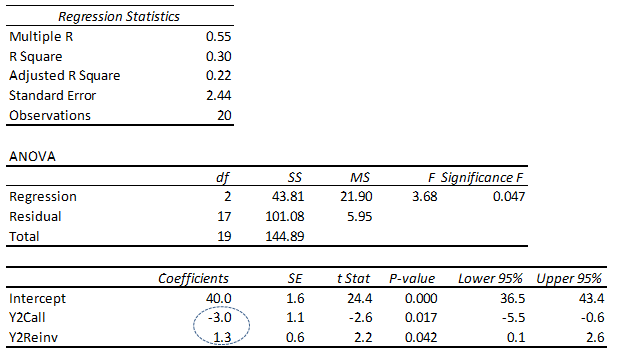
Source: APS
More work to do
The manager, liquidity and other factors also likely weigh into market spreads. But the finding that even a single day’s secondary activity significantly reflects the influence of non-call and reinvestment periods bodes well for efforts to model spreads and estimate fair value. And once we know fair value, better value should be even clearer.
This material is intended only for institutional investors and does not carry all of the independence and disclosure standards of retail debt research reports. In the preparation of this material, the author may have consulted or otherwise discussed the matters referenced herein with one or more of SCM’s trading desks, any of which may have accumulated or otherwise taken a position, long or short, in any of the financial instruments discussed in or related to this material. Further, SCM may act as a market maker or principal dealer and may have proprietary interests that differ or conflict with the recipient hereof, in connection with any financial instrument discussed in or related to this material.
This message, including any attachments or links contained herein, is subject to important disclaimers, conditions, and disclosures regarding Electronic Communications, which you can find at https://portfolio-strategy.apsec.com/sancap-disclaimers-and-disclosures.
Important Disclaimers
Copyright © 2026 Santander US Capital Markets LLC and its affiliates (“SCM”). All rights reserved. SCM is a member of FINRA and SIPC. This material is intended for limited distribution to institutions only and is not publicly available. Any unauthorized use or disclosure is prohibited.
In making this material available, SCM (i) is not providing any advice to the recipient, including, without limitation, any advice as to investment, legal, accounting, tax and financial matters, (ii) is not acting as an advisor or fiduciary in respect of the recipient, (iii) is not making any predictions or projections and (iv) intends that any recipient to which SCM has provided this material is an “institutional investor” (as defined under applicable law and regulation, including FINRA Rule 4512 and that this material will not be disseminated, in whole or part, to any third party by the recipient.
The author of this material is an economist, desk strategist or trader. In the preparation of this material, the author may have consulted or otherwise discussed the matters referenced herein with one or more of SCM’s trading desks, any of which may have accumulated or otherwise taken a position, long or short, in any of the financial instruments discussed in or related to this material. Further, SCM or any of its affiliates may act as a market maker or principal dealer and may have proprietary interests that differ or conflict with the recipient hereof, in connection with any financial instrument discussed in or related to this material.
This material (i) has been prepared for information purposes only and does not constitute a solicitation or an offer to buy or sell any securities, related investments or other financial instruments, (ii) is neither research, a “research report” as commonly understood under the securities laws and regulations promulgated thereunder nor the product of a research department, (iii) or parts thereof may have been obtained from various sources, the reliability of which has not been verified and cannot be guaranteed by SCM, (iv) should not be reproduced or disclosed to any other person, without SCM’s prior consent and (v) is not intended for distribution in any jurisdiction in which its distribution would be prohibited.
In connection with this material, SCM (i) makes no representation or warranties as to the appropriateness or reliance for use in any transaction or as to the permissibility or legality of any financial instrument in any jurisdiction, (ii) believes the information in this material to be reliable, has not independently verified such information and makes no representation, express or implied, with regard to the accuracy or completeness of such information, (iii) accepts no responsibility or liability as to any reliance placed, or investment decision made, on the basis of such information by the recipient and (iv) does not undertake, and disclaims any duty to undertake, to update or to revise the information contained in this material.
Unless otherwise stated, the views, opinions, forecasts, valuations, or estimates contained in this material are those solely of the author, as of the date of publication of this material, and are subject to change without notice. The recipient of this material should make an independent evaluation of this information and make such other investigations as the recipient considers necessary (including obtaining independent financial advice), before transacting in any financial market or instrument discussed in or related to this material.
Important disclaimers for clients in the EU and UK
This publication has been prepared by Trading Desk Strategists within the Sales and Trading functions of Santander US Capital Markets LLC (“SanCap”), the US registered broker-dealer of Santander Corporate & Investment Banking. This communication is distributed in the EEA by Banco Santander S.A., a credit institution registered in Spain and authorised and regulated by the Bank of Spain and the CNMV. Any EEA recipient of this communication that would like to affect any transaction in any security or issuer discussed herein should do so with Banco Santander S.A. or any of its affiliates (together “Santander”). This communication has been distributed in the UK by Banco Santander, S.A.’s London branch, authorised by the Bank of Spain and subject to regulatory oversight on certain matters by the Financial Conduct Authority (FCA) and the Prudential Regulation Authority (PRA).
The publication is intended for exclusive use for Professional Clients and Eligible Counterparties as defined by MiFID II and is not intended for use by retail customers or for any persons or entities in any jurisdictions or country where such distribution or use would be contrary to local law or regulation.
This material is not a product of Santander´s Research Team and does not constitute independent investment research. This is a marketing communication and may contain ¨investment recommendations¨ as defined by the Market Abuse Regulation 596/2014 ("MAR"). This publication has not been prepared in accordance with legal requirements designed to promote the independence of research and is not subject to any prohibition on dealing ahead of the dissemination of investment research. The author, date and time of the production of this publication are as indicated herein.
This publication does not constitute investment advice and may not be relied upon to form an investment decision, nor should it be construed as any offer to sell or issue or invitation to purchase, acquire or subscribe for any instruments referred herein. The publication has been prepared in good faith and based on information Santander considers reliable as of the date of publication, but Santander does not guarantee or represent, express or implied, that such information is accurate or complete. All estimates, forecasts and opinions are current as at the date of this publication and are subject to change without notice. Unless otherwise indicated, Santander does not intend to update this publication. The views and commentary in this publication may not be objective or independent of the interests of the Trading and Sales functions of Santander, who may be active participants in the markets, investments or strategies referred to herein and/or may receive compensation from investment banking and non-investment banking services from entities mentioned herein. Santander may trade as principal, make a market or hold positions in instruments (or related derivatives) and/or hold financial interest in entities discussed herein. Santander may provide market commentary or trading strategies to other clients or engage in transactions which may differ from views expressed herein. Santander may have acted upon the contents of this publication prior to you having received it.
This publication is intended for the exclusive use of the recipient and must not be reproduced, redistributed or transmitted, in whole or in part, without Santander’s consent. The recipient agrees to keep confidential at all times information contained herein.


