Uncategorized
Measuring relative value through spread-per-turn-of-leverage
admin | January 11, 2019
This material is a Marketing Communication and does not constitute Independent Investment Research.
The nearly 5-point drop in average leveraged loan prices from September to January and the recent rebound has reminded CLO investors that the risk to debt and equity can change quickly. Tracking changes in risk and fair value across CLO classes can be difficult, but the notions of leverage and spread-per-turn-of-leverage turn out to be extremely useful with stable patterns across classes and over time.
Moving from MVOC to leverage
Even though CLO debt does not rely on the market value of underlying loans for repayment, debt pricing should reflect the changing market value of deal assets. Falling loan prices arguably reflect a rising implied probability of loan default and loss, which would affect repayment. However, not all CLO classes have equal exposure.
CLO investors currently use the market value of overcollateralization or MVOC to gauge class exposure to asset value, but leverage reflects the same information in an arguably more useful way. MVOC reflects the market value of deal assets as a percent of the par value of a class and all senior classes. Leverage reflects the market value of deal assets as a multiple of remaining equity if the deal only issued a given class and all senior classes. An example helps illustrate the difference.
Credit Suisse Asset Management priced Madison Park XXIX in late September, raising $744 million in debt and $56 million in market value equity to buy an estimated $800 million in market value leveraged loans (Exhibit 1). After issuing ‘AAA’ through ‘B’ debt, the deal shows an MVOC for the ‘B’ class of 107.5 and leverage of 14.29. At this point, the measures are interchangeable for practical purposes. Both reflect the ability of asset liquidation value to cover the par value of CLO debt.
Exhibit 1: Comparing MVOC and leverage across class of Madison Park XXIX
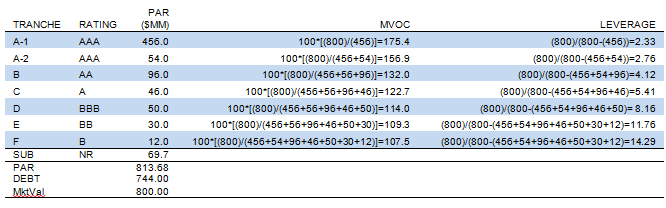
Note: Market value as 9/28/18 assumes the manager purchased all loans in the deal at par. Source: S&P, APS
The difference between MVOC and leverage becomes much clearer after plotting one against the other (Exhibit 2). At high levels of MVOC, small or even large changes have very little impact on leverage. That makes sense since adding a few dollars of debt below ‘AAA’, for instance, only reduces net equity by a small amount. However, at low levels of MVOC, small differences have an exponential effect on leverage. As the market value of assets approaches the par value of issued debt, net equity rapidly disappears and leverage rises to infinity. In other words, the lowest classes of CLOs are highly leveraged to small changes in the value of CLO assets.
Exhibit 2: Leverage explodes as MVOC approaches 100
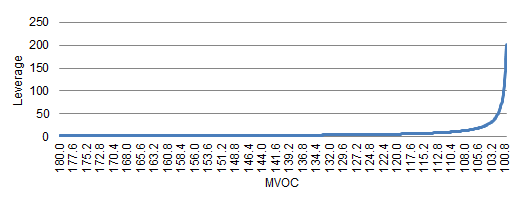
Source: APS
Consistent spread-per-turn-of-leverage across CLO classes
Leverage arguably becomes much more useful under the assumption that investors demand more spread for every turn of leverage. That looks like the case in Madison Park XXIX since the spread per turn of leverage in each class at issuance falls within a relatively narrow range (Exhibit 3). Discount margin ranges from 114 bp to 790 bp, but discount margin or spread per turn of leverage only ranges from 37 bp to 55 bp.
Exhibit 3: Wide range in spreads, narrow range in SPTL* in Madison Park XXIX
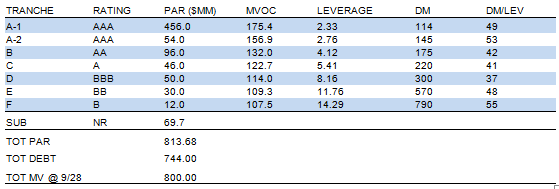
Note: *SPTL = spread-per-turn-of-leverage. Market value at 9/28/18 assumes the manager purchased all loans in the deal at par. Source: S&P, APS.
Consistent spread-per-turn-of-leverage over time
The assumption that CLO investors demand more spread for every turn of leverage also looks plausible over time (Exhibit 4). The CLO market has seen three episodes of material declines in the average value of leveraged loans: one in 2011, one from 2015 into 2016 and one recently. In each episode, the ‘BB’ and, to a lesser extent, the ‘BBB’ classes failed to nominally widen enough to compensate for the rapidly rising leverage in these classes. In 2011, the ratio actually went negative as loan prices fell far enough to more than wipe out the equity class in the median deal. In the 2015 through 2016 episode, spread per turn of leverage on the median ‘BB’ class dropped to 10 bp and in the latest episode toward 20 bp. Investment grade classes, however, have widened smoothly in line with rising median class leverage to offer a relatively narrow range of compensation. From mid-2013 to mid-2015, that range was 40 bp to 60 bp. Since early 2017, the range has run from 30 bp to 45 bp.
Exhibit 4: Falling loan prices drive up CLO leverage, but spreads accommodate
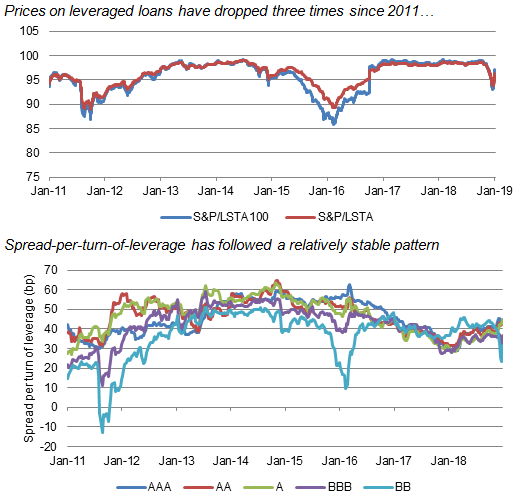
Note: Spread-per-turn-of-leverage reflects the spread, MVOC and leverage of the median outstanding CLO. Source: Bloomberg, APS
Both the spread per turn of leverage offered across CLO classes at issuance and in the primary and secondary markets over time strongly suggest that the market at least implicitly prices CLO risk in line. The measure should differ from manager to manager and across non-call and reinvestment windows. However, it’s potential to measure nominally very different CLO assets makes it a valuable measure of relative value to watch across time and across offerings.
This material is intended only for institutional investors and does not carry all of the independence and disclosure standards of retail debt research reports. In the preparation of this material, the author may have consulted or otherwise discussed the matters referenced herein with one or more of SCM’s trading desks, any of which may have accumulated or otherwise taken a position, long or short, in any of the financial instruments discussed in or related to this material. Further, SCM may act as a market maker or principal dealer and may have proprietary interests that differ or conflict with the recipient hereof, in connection with any financial instrument discussed in or related to this material.
This message, including any attachments or links contained herein, is subject to important disclaimers, conditions, and disclosures regarding Electronic Communications, which you can find at https://portfolio-strategy.apsec.com/sancap-disclaimers-and-disclosures.
Important Disclaimers
Copyright © 2026 Santander US Capital Markets LLC and its affiliates (“SCM”). All rights reserved. SCM is a member of FINRA and SIPC. This material is intended for limited distribution to institutions only and is not publicly available. Any unauthorized use or disclosure is prohibited.
In making this material available, SCM (i) is not providing any advice to the recipient, including, without limitation, any advice as to investment, legal, accounting, tax and financial matters, (ii) is not acting as an advisor or fiduciary in respect of the recipient, (iii) is not making any predictions or projections and (iv) intends that any recipient to which SCM has provided this material is an “institutional investor” (as defined under applicable law and regulation, including FINRA Rule 4512 and that this material will not be disseminated, in whole or part, to any third party by the recipient.
The author of this material is an economist, desk strategist or trader. In the preparation of this material, the author may have consulted or otherwise discussed the matters referenced herein with one or more of SCM’s trading desks, any of which may have accumulated or otherwise taken a position, long or short, in any of the financial instruments discussed in or related to this material. Further, SCM or any of its affiliates may act as a market maker or principal dealer and may have proprietary interests that differ or conflict with the recipient hereof, in connection with any financial instrument discussed in or related to this material.
This material (i) has been prepared for information purposes only and does not constitute a solicitation or an offer to buy or sell any securities, related investments or other financial instruments, (ii) is neither research, a “research report” as commonly understood under the securities laws and regulations promulgated thereunder nor the product of a research department, (iii) or parts thereof may have been obtained from various sources, the reliability of which has not been verified and cannot be guaranteed by SCM, (iv) should not be reproduced or disclosed to any other person, without SCM’s prior consent and (v) is not intended for distribution in any jurisdiction in which its distribution would be prohibited.
In connection with this material, SCM (i) makes no representation or warranties as to the appropriateness or reliance for use in any transaction or as to the permissibility or legality of any financial instrument in any jurisdiction, (ii) believes the information in this material to be reliable, has not independently verified such information and makes no representation, express or implied, with regard to the accuracy or completeness of such information, (iii) accepts no responsibility or liability as to any reliance placed, or investment decision made, on the basis of such information by the recipient and (iv) does not undertake, and disclaims any duty to undertake, to update or to revise the information contained in this material.
Unless otherwise stated, the views, opinions, forecasts, valuations, or estimates contained in this material are those solely of the author, as of the date of publication of this material, and are subject to change without notice. The recipient of this material should make an independent evaluation of this information and make such other investigations as the recipient considers necessary (including obtaining independent financial advice), before transacting in any financial market or instrument discussed in or related to this material.
Important disclaimers for clients in the EU and UK
This publication has been prepared by Trading Desk Strategists within the Sales and Trading functions of Santander US Capital Markets LLC (“SanCap”), the US registered broker-dealer of Santander Corporate & Investment Banking. This communication is distributed in the EEA by Banco Santander S.A., a credit institution registered in Spain and authorised and regulated by the Bank of Spain and the CNMV. Any EEA recipient of this communication that would like to affect any transaction in any security or issuer discussed herein should do so with Banco Santander S.A. or any of its affiliates (together “Santander”). This communication has been distributed in the UK by Banco Santander, S.A.’s London branch, authorised by the Bank of Spain and subject to regulatory oversight on certain matters by the Financial Conduct Authority (FCA) and the Prudential Regulation Authority (PRA).
The publication is intended for exclusive use for Professional Clients and Eligible Counterparties as defined by MiFID II and is not intended for use by retail customers or for any persons or entities in any jurisdictions or country where such distribution or use would be contrary to local law or regulation.
This material is not a product of Santander´s Research Team and does not constitute independent investment research. This is a marketing communication and may contain ¨investment recommendations¨ as defined by the Market Abuse Regulation 596/2014 ("MAR"). This publication has not been prepared in accordance with legal requirements designed to promote the independence of research and is not subject to any prohibition on dealing ahead of the dissemination of investment research. The author, date and time of the production of this publication are as indicated herein.
This publication does not constitute investment advice and may not be relied upon to form an investment decision, nor should it be construed as any offer to sell or issue or invitation to purchase, acquire or subscribe for any instruments referred herein. The publication has been prepared in good faith and based on information Santander considers reliable as of the date of publication, but Santander does not guarantee or represent, express or implied, that such information is accurate or complete. All estimates, forecasts and opinions are current as at the date of this publication and are subject to change without notice. Unless otherwise indicated, Santander does not intend to update this publication. The views and commentary in this publication may not be objective or independent of the interests of the Trading and Sales functions of Santander, who may be active participants in the markets, investments or strategies referred to herein and/or may receive compensation from investment banking and non-investment banking services from entities mentioned herein. Santander may trade as principal, make a market or hold positions in instruments (or related derivatives) and/or hold financial interest in entities discussed herein. Santander may provide market commentary or trading strategies to other clients or engage in transactions which may differ from views expressed herein. Santander may have acted upon the contents of this publication prior to you having received it.
This publication is intended for the exclusive use of the recipient and must not be reproduced, redistributed or transmitted, in whole or in part, without Santander’s consent. The recipient agrees to keep confidential at all times information contained herein.


