Uncategorized
Ginnie Mae Puerto Rico pools after the hurricane
admin | January 11, 2019
This material is a Marketing Communication and does not constitute Independent Investment Research.
Ginnie Mae MBS backed by Puerto Rico loans have long been a good source of call protection for investors. Hurricane Maria in September 2017 put this in doubt, since the devastation drove delinquency rates extremely high. However, the delinquency rate in Ginnie Mae MBS has fallen steadily over the last year, leaving little risk of a large spike in prepayments from buyouts. These Ginnie Mae pools appear to be extremely undervalued, trading with pay-ups around 20% of theoretical value. It is possible that the market is still pricing as if Puerto Rico pools have excessive buyout risk.
Delinquency rates have fallen substantially
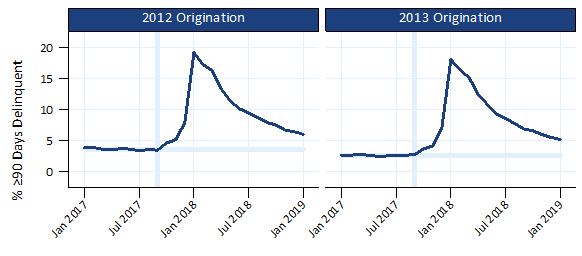
Delinquency rates in Ginnie Mae Puerto Rico pools are nearly back to the levels pre-hurricane. This means that these pools have little risk of a large jump in buyouts. Exhibit 1 (below) shows the percent of loans at least 90 days delinquent in 2012 and 2013 vintage Puerto Rico pools, before and after Hurricane Maria.
Exhibit 1: >= 90 day delinquency rates have recovered
Source: Ginnie Mae, eMBS, Amherst Pierpont Securities
The vertical line marks September 2017, when Hurricane Maria struck. The horizontal line marks the average delinquency rate in 2017 before the hurricane.
Delinquencies peaked at nearly 20% in January 2018, four months after the hurricane. Current delinquency rates are roughly 5%, close to the levels (3% to 4%) observed before the hurricane.
Buyout rates increased modestly
Prepayment rates increased after delinquencies peaked and some loans were bought out. However, there was never a massive jump in prepayments. Pre-hurricane buyout rates were typically around 2 CPR and peaked at 6 CPR in mid-2018. Buyout rates are shown in Exhibit 2:
Exhibit 2: Ginnie Mae buyout rates increased slightly after Hurricane Maria
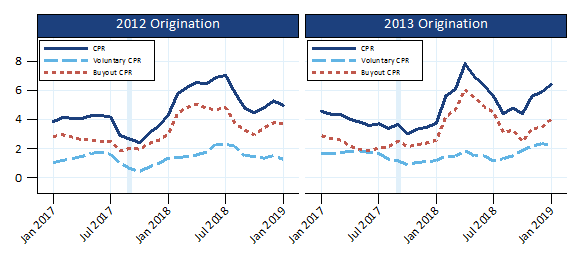
Source: Ginnie Mae, eMBS, Amherst Pierpont Securities
A large jump in buyouts would have been much worse, since no one wants to own the pool (at a premium) in that one month. That risk would hurt liquidity for the pools.
It also appears that many of the loans cured naturally. For example, assume the hurricane caused 15% of loans to go delinquent and that one year later they have either cured or been bought out. If the buyout rate is 5 CPR then the cure rate must have been 15 CPR – 5 CPR, or 10 CPR. Therefore two-thirds of the delinquent loans cured naturally. It looks like borrower and lender assistance policies offered by Ginnie Mae, FHA, VA, and USDA allowed many loans to cure, protecting investors from unnecessary prepayments.
Conventional MBS prepaid far faster than Ginnie Mae MBS
Conventional Puerto Rico pools exhibited much worse prepayment behavior than Ginnie Mae MBS following the hurricane. Prepayments increased over the first half of the year and peaked over 40 CPR, much faster than the peak 8 CPR in Ginnie Mae pools. This is shown in Exhibit 3:
Exhibit 3: Conventional pools prepaid much faster than Ginnie Mae
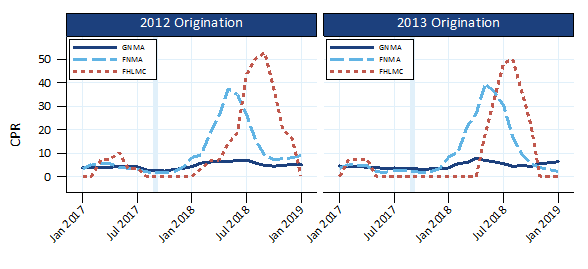
Source: Fannie Mae, Freddie Mac, Ginnie Mae, eMBS, Amherst Pierpont Securities
Even though Freddie Mac reports pool-level buyouts, the Puerto Rico prepays were reported as voluntary prepayments.
Pay-ups for Ginnie Mae Puerto Rico pools are very low
The prepayment protection offered by Puerto Rico pools appears to be undervalued in the market. Exhibit 4 shows that pay-ups for 2013 vintage 3.5% and 4.0% coupon Puerto Rico pools are roughly 20% of theoretical value. This was calculated by selecting two representative 100% Puerto Rico pools and running them at the same OAS as the TBA.
Exhibit 4: Puerto Rico payups are extremely low (as of 1/9/2019)
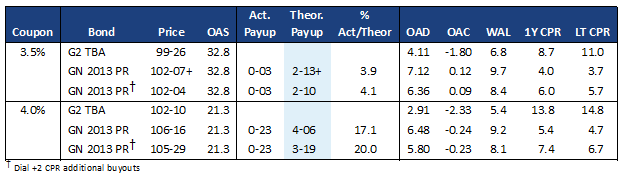
Source: Yield Book, Amherst Pierpont Securities
Each pool is run two different ways:
- Yield Book’s production model
- Dial Yield Book to run 2 CPR faster, to account for elevated buyout rates
Actual pay-ups are much lower than theoretical pay-ups in both cases.
Conclusion
Puerto Rico pools have historically prepaid very slowly. But investors feared that the hurricane would cause a huge increase in prepayment speeds, which has likely suppressed payups for these pools. However, Ginnie Mae MBS did not experience a large increase in prepayment speeds, and delinquency rates are approaching historical levels. Therefore prepayment speeds should be reasonably close to historical experience. Low payups make these pools look very attractive.
Investors should also note that the Ginnie Mae pools never experienced a large spike in prepayments following the hurricane. Borrower and lender assistance policies offered by Ginnie Mae, FHA, VA, and USDA allowed many loans to cure, protecting investors from unnecessary prepayments. Fannie Mae and Freddie Mac Puerto Rico pools did not fare as well, prepaying over 40 CPR last summer.
This material is intended only for institutional investors and does not carry all of the independence and disclosure standards of retail debt research reports. In the preparation of this material, the author may have consulted or otherwise discussed the matters referenced herein with one or more of SCM’s trading desks, any of which may have accumulated or otherwise taken a position, long or short, in any of the financial instruments discussed in or related to this material. Further, SCM may act as a market maker or principal dealer and may have proprietary interests that differ or conflict with the recipient hereof, in connection with any financial instrument discussed in or related to this material.
This message, including any attachments or links contained herein, is subject to important disclaimers, conditions, and disclosures regarding Electronic Communications, which you can find at https://portfolio-strategy.apsec.com/sancap-disclaimers-and-disclosures.
Important Disclaimers
Copyright © 2026 Santander US Capital Markets LLC and its affiliates (“SCM”). All rights reserved. SCM is a member of FINRA and SIPC. This material is intended for limited distribution to institutions only and is not publicly available. Any unauthorized use or disclosure is prohibited.
In making this material available, SCM (i) is not providing any advice to the recipient, including, without limitation, any advice as to investment, legal, accounting, tax and financial matters, (ii) is not acting as an advisor or fiduciary in respect of the recipient, (iii) is not making any predictions or projections and (iv) intends that any recipient to which SCM has provided this material is an “institutional investor” (as defined under applicable law and regulation, including FINRA Rule 4512 and that this material will not be disseminated, in whole or part, to any third party by the recipient.
The author of this material is an economist, desk strategist or trader. In the preparation of this material, the author may have consulted or otherwise discussed the matters referenced herein with one or more of SCM’s trading desks, any of which may have accumulated or otherwise taken a position, long or short, in any of the financial instruments discussed in or related to this material. Further, SCM or any of its affiliates may act as a market maker or principal dealer and may have proprietary interests that differ or conflict with the recipient hereof, in connection with any financial instrument discussed in or related to this material.
This material (i) has been prepared for information purposes only and does not constitute a solicitation or an offer to buy or sell any securities, related investments or other financial instruments, (ii) is neither research, a “research report” as commonly understood under the securities laws and regulations promulgated thereunder nor the product of a research department, (iii) or parts thereof may have been obtained from various sources, the reliability of which has not been verified and cannot be guaranteed by SCM, (iv) should not be reproduced or disclosed to any other person, without SCM’s prior consent and (v) is not intended for distribution in any jurisdiction in which its distribution would be prohibited.
In connection with this material, SCM (i) makes no representation or warranties as to the appropriateness or reliance for use in any transaction or as to the permissibility or legality of any financial instrument in any jurisdiction, (ii) believes the information in this material to be reliable, has not independently verified such information and makes no representation, express or implied, with regard to the accuracy or completeness of such information, (iii) accepts no responsibility or liability as to any reliance placed, or investment decision made, on the basis of such information by the recipient and (iv) does not undertake, and disclaims any duty to undertake, to update or to revise the information contained in this material.
Unless otherwise stated, the views, opinions, forecasts, valuations, or estimates contained in this material are those solely of the author, as of the date of publication of this material, and are subject to change without notice. The recipient of this material should make an independent evaluation of this information and make such other investigations as the recipient considers necessary (including obtaining independent financial advice), before transacting in any financial market or instrument discussed in or related to this material.
Important disclaimers for clients in the EU and UK
This publication has been prepared by Trading Desk Strategists within the Sales and Trading functions of Santander US Capital Markets LLC (“SanCap”), the US registered broker-dealer of Santander Corporate & Investment Banking. This communication is distributed in the EEA by Banco Santander S.A., a credit institution registered in Spain and authorised and regulated by the Bank of Spain and the CNMV. Any EEA recipient of this communication that would like to affect any transaction in any security or issuer discussed herein should do so with Banco Santander S.A. or any of its affiliates (together “Santander”). This communication has been distributed in the UK by Banco Santander, S.A.’s London branch, authorised by the Bank of Spain and subject to regulatory oversight on certain matters by the Financial Conduct Authority (FCA) and the Prudential Regulation Authority (PRA).
The publication is intended for exclusive use for Professional Clients and Eligible Counterparties as defined by MiFID II and is not intended for use by retail customers or for any persons or entities in any jurisdictions or country where such distribution or use would be contrary to local law or regulation.
This material is not a product of Santander´s Research Team and does not constitute independent investment research. This is a marketing communication and may contain ¨investment recommendations¨ as defined by the Market Abuse Regulation 596/2014 ("MAR"). This publication has not been prepared in accordance with legal requirements designed to promote the independence of research and is not subject to any prohibition on dealing ahead of the dissemination of investment research. The author, date and time of the production of this publication are as indicated herein.
This publication does not constitute investment advice and may not be relied upon to form an investment decision, nor should it be construed as any offer to sell or issue or invitation to purchase, acquire or subscribe for any instruments referred herein. The publication has been prepared in good faith and based on information Santander considers reliable as of the date of publication, but Santander does not guarantee or represent, express or implied, that such information is accurate or complete. All estimates, forecasts and opinions are current as at the date of this publication and are subject to change without notice. Unless otherwise indicated, Santander does not intend to update this publication. The views and commentary in this publication may not be objective or independent of the interests of the Trading and Sales functions of Santander, who may be active participants in the markets, investments or strategies referred to herein and/or may receive compensation from investment banking and non-investment banking services from entities mentioned herein. Santander may trade as principal, make a market or hold positions in instruments (or related derivatives) and/or hold financial interest in entities discussed herein. Santander may provide market commentary or trading strategies to other clients or engage in transactions which may differ from views expressed herein. Santander may have acted upon the contents of this publication prior to you having received it.
This publication is intended for the exclusive use of the recipient and must not be reproduced, redistributed or transmitted, in whole or in part, without Santander’s consent. The recipient agrees to keep confidential at all times information contained herein.


