


Uncategorized
Tightening financial conditions, but not enough to hurt
admin | January 11, 2019
This material is a Marketing Communication and does not constitute Independent Investment Research.
The plunge in stock prices and widening of risk spreads over the past few months have led to a significant rethink regarding the economic outlook. For much of 2018, it was fear of a yield curve inversion in Treasuries that led market participants to be less upbeat about the economic outlook than economists and Fed officials. Over the past few months, it has been a broader tightening of financial conditions that has market participants worried that the economy is vulnerable and the Fed may get too aggressive with its rate hike strategy. The Chicago Fed National Financial Conditions Index (NFCI) offers a way of putting recent market moves in perspective. At least so far, the adjustment in financial conditions as measured by the NFCI is probably not enough to have a substantial impact on the economic outlook.
The Chicago Fed Financial Conditions Measure
There are a variety of different measures of financial conditions. Most of the ones that market participants are familiar with include only a handful of variables, such as stock prices, a trade-weighted currency, and a few interest rate spreads. The Chicago Fed sought to construct a more comprehensive index. The NFCI includes over 100 variables, incorporating a variety of interest rate spreads, measures of banks’ lending stance, a number of liquidity measures, asset prices, and debt levels. The index has three broad components: risk, credit, and leverage. The components are combined into a single index that has an average (going back to 1971) of zero and a standard deviation of 1. Positive numbers reflect tighter-than-usual financial conditions and negative readings indicate looser-than-average conditions.
The history of the series going back to 1990 can be seen in Exhibit 1. Two observations stand out. First, even after the small tightening in recent months, financial conditions remain broadly easy. Second, the movement seen in the past few months appears modest in a long, historical context. To be fair, the dust has not yet fully settled. In fact, a number of the 105 series in the index are monthly and in some cases even quarterly, so the NFCI has not yet fully incorporated the financial upheaval experienced in the past several weeks.
Exhibit 1: Chicago Fed financial conditions index
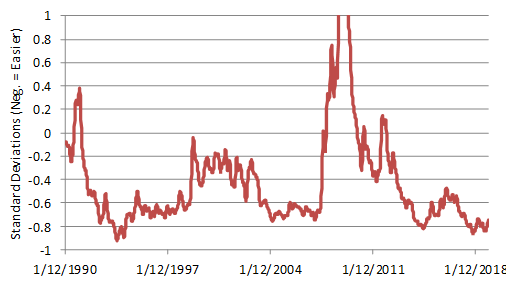
Source: Chicago Federal Reserve
Comparing Market Hiccups
With the caveat that the NFCI will probably tighten somewhat further going forward as lower-frequency variables are filled in, it may be useful to compare the current episode with prior examples of market turmoil. The two most recent instances to look at are the stock market plunges of the summer of 2015 and early 2016. There are a variety of similarities between those two episodes and the current market volatility, the two most notable being that tumult in China sparked a global selloff in risk assets and the Fed responded by delaying its prior plans to increase interest rates (of course, the Fed has not actually changed course yet but is sending signals in that direction).
As Exhibit 2 shows, the tightening in financial conditions in recent weeks has been generally comparable to that seen in each of these two prior episodes. It is also worth noting that financial conditions were easier a few months ago than they were in 2015 (when the fed funds rate target was still at the zero bound) and in early 2016 (when the Fed had just hiked rates for the first time). In fact, the Chicago Fed NFCI had registered a 25-year extreme last fall. To go even further, the latest reading of -0.71 for the week of January 4, which was the tightest since April, was still as easy as the “best” reading seen in the summer of 2015 and easier than financial conditions prior to the early 2016 hiccup.
Exhibit 2: Comparing financial market episodes
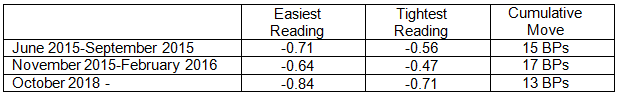
Source: Chicago Federal Reserve
Although it is impossible to know in real time how these episodes will play out (because you never know when you have hit an extreme until well after conditions have turned), it is important to note that the two financial market bobbles in 2015 and early 2016 had little lasting impact on the economy. The Fed in each case delayed its prior plans of normalization by three to six months and never made any effort to “catch up for lost time” after financial conditions became more favorable again.
Widening the Net
To offer further perspective, we can look at a few other, more severe episodes of tightening financial conditions. I am choosing three. First, in the 1998 period, the Russian debt default helped to lead to the demise of Long-Term Capital Management and threw the financial markets into a severe tailspin. Stock prices plunged and Treasury yields slid by over 100 BPs in a couple of months. The Fed responded by easing three times in about six weeks, which helped to stabilize financial market conditions. In the end, the economy never missed a beat (real GDP increased by more than 5% in Q3 and over 6% in Q4!), and by waiting until mid-1999 to reverse the easing that had proven unnecessary from an economic perspective, the Fed arguably exacerbated the stock market bubble in 1999 and early 2000. Second, unlike in 1998, the unwinding of the NASDAQ bubble in 2000 did contribute to a softening in the economy. A recession began in 2001 but was ultimately unusually shallow and the weakening might not have even qualified as a recession if it had not been for the fallout from the 9/11 terrorist attacks. Finally, the massive tightening in financial conditions in 2007 and 2008 is probably not analogous but is worth including as a limit on how bad things can get. Exhibit 3 adds those episodes to the prior exhibit.
Exhibit 3: Comparing financial market episodes
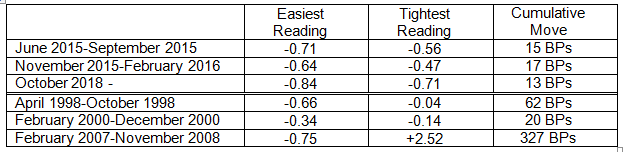
Source: Chicago Federal Reserve
Despite the intense slide in tech stock prices, the deterioration in financial conditions in 2000 was surprisingly not much worse than in the three more recent instances. This may help explain why the economic downturn in 2001 was relatively mild until the 9/11 attacks. In contrast, the 2007-08 period is not even remotely comparable to the current environment (and hopefully will not be relevant again in my lifetime!). In the depths of the markets’ gyrations around the turn of 2018, I thought that the best analogy for the current situation might end up being the 1998 scenario, but the recent recovery in risk assets over the past few trading days suggests that we may not stretch to that degree of crisis sentiment. The tightening of the NFCI 20 years ago was several times greater than what we have seen over the past few months (at least so far).
Preliminary Verdict
Given the broad nature of the NFCI and the fact that it includes a number of series that do not update daily (or even weekly), it is too soon to make any final determinations. My guess is that when all is said and done, the current instance will look a little more severe than the summer 2015 and early 2016 episodes. However, I would tentatively add that the rebound over the last week or so, if it holds, has also been quicker and more violent than in the aftermath of those financial market hiccups. The 1998 comparison, which seemed reasonable a week ago, is looking less valid by the day.
My concern is that the Fed has a long history of reacting very quickly to a tightening in financial conditions and then failing to unwind that reaction in a timely manner when financial conditions turn around. In my view, the delays in the Fed’s normalization strategy in the fall of 2015 and early 2016 contributed to the central bank falling behind the curve and leaving policy too easy for too long, which in turn helped to create the sort of super-easy financial conditions in 2017 and 2018 that necessitated the correction seen over the past few months. Certainly, the 1998 experience is an even more extreme case, where the Fed eased three times in the midst of a very strong economy and took almost a year to reverse course, even though financial conditions had bounced back considerably well before then.
As long as inflation is relatively well-behaved, the FOMC does have the luxury of being “patient” and ”flexible,” as officials have emphasized this week. Moreover, the snugging of financial conditions will actually at the margin help the Fed in terms of preventing a financial overheating, such as was seen in 2003-2006 or 1998-1999, which could ultimately limit how much further the Fed has to raise rates to get the economy back to a sustainable track. However, history suggests that while failing to be responsive to a tightening in financial conditions is the clear and present danger, Fed officials have historically been more susceptible to growing complacent and pausing for too long, if, as in several of the prior episodes, the economy shows little lasting damage from the recent market upheaval.