


Uncategorized
A Sharpe focus on RMBS exposure
admin | January 11, 2019
This material is a Marketing Communication and does not constitute Independent Investment Research.
Private RMBS may likely become a larger part of portfolios looking to both add out-of-index exposure and pivot away from corporate and towards consumer balance sheets. Given recent market volatility, private RMBS may look attractive against other consumer assets given its expected risk-adjusted returns. Investors also have a growing set of options for getting RMBS exposure ranging from legacy deals to newly issued RMBS as well as new securitizations of seasoned loans and risk-transfer deals backed by GSE collateral. Legacy RMBS still appears to offer the best risk-adjusted returns by a fairly wide margin based on the last few years of performance, but replicating a passive exposure to the legacy market is nearly impossible, likely pushing investors into other exposures.
The combination of strong fundamentals, tighter spreads and depressed volatility has been the hat trick for RMBS of all flavors to post impressive risk adjusted returns over the past two years. Steady returns have attracted continued inflows to the sector, driving spreads continually tighter, further bolstering performance and keeping price volatility low. Inflows have likely not only been influenced by returns but the relatively loose correlation of those returns to assets like Treasuries, agency mortgages and corporates. (Exhibit 1)
Exhibit 1: Three year correlation of RMBS versus competing assets
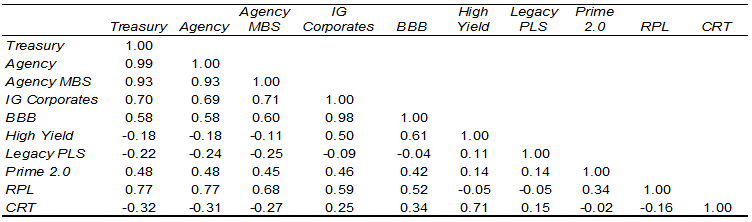
Source: Amherst Insight Labs, Yield Book, Bloomberg LP, IDC, Amherst Pierpont. Note: Monthly returns are January 2016 to December 2018. Treasury, Agency MBS, Corporate, BBB and High Yield returns are derived from Citi US BIG Indices. Prime 2.0, legacy and non-agency, CRT and RPL returns and correlations are calculated using only principal and interest bonds where a monthly total return could be calculated over a three-year horizon.
One of the factors that may weigh on how investors choose to gain private label exposure is how highly or loosely correlated these assets are to rates, MBS or specifically corporate exposures. If the investment hypothesis driving inflows into private label is that corporate assets should underperform consumer ones, then investors should look for RMBS exposures with the loosest correlations to corporates whether that be all investment grade corporates, BBB rated ones or high yield.
The broad legacy market actually shows negative correlation to both investment grade and BBB corporates over the past three years and a very loose correlation to high yield, potentially making it the best candidate for investors who are looking for an alternative to corporates. Both new issue prime and RPL transactions show a reasonably strong correlation to investment grade and BBB corporates but limited correlation to high yield. Conversely, GSE CRT bonds show limited correlation to investment grade corporates but a very strong correlation to high yield.
Roughly 10% of the outstanding legacy universe trades in a given year. And as a result, it would be virtually impossible to construct a truly passive exposure that could replicate the returns and correlations represented above. Investors would likely have a somewhat greater ability to replicate a passive exposure in prime 2.0, CRT or RPL – although there may be some limitations there as well.
Given those limitations, we look at subsectors of each market where investors can realistically get more targeted exposures and evaluate which of those offer the best risk adjusted returns in each category of RMBS. We cut the legacy market by underlying collateral credit and bond structure, the CRT market by investment grade, non-investment grade mezzanine and class B notes across high and low LTV issuance and the RPL market by original rating and map those exposures by average monthly return and volatility of return. (Exhibit 2)
Exhibit 2: Mapping return and volatility across RMBS exposures
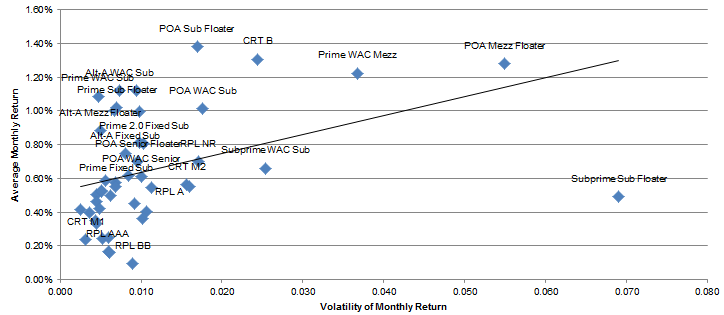
Source: Amherst Insight Labs, Yield Book, Bloomberg LP, IDC, Amherst Pierpont
Certain sectors of the legacy market have posted almost incomprehensible Sharpe ratios over the past three years as certain prime and Alt-A subs have registered annualized Sharpe ratios greater than five over that observation period. Admittedly, as significant portion of this can be attributed the overall low volatility environment coupled with limited liquidity and transparency in pricing these assets. While limited liquidity and transparency will always be elements of the legacy market, limited volatility is likely less so. Looking at different sub-sectors of the legacy market over a shorter 6-month horizon and annualizing both returns and volatility show that certain subsectors of the market like prime subs and Alt-A mezzanine bonds offer comparable risk adjusted returns in periods of increased volatility while certain senior cash flows, particularly Alt-A bonds offer less attractive risk-adjusted returns than they have historically. (Exhibit 3)
Exhibit 3: Comparing long and short term risk-adjusted returns in legacy RMBS
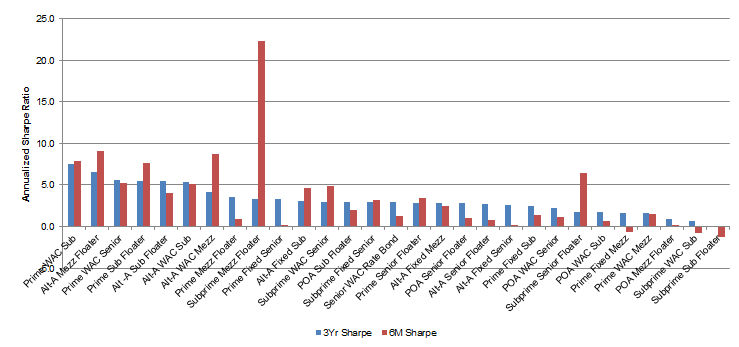
Source: Amherst Insight Labs, IDC, Amherst Pierpont
Turning to the new issue market we focus solely on 2.0 prime jumbo transactions. Both the expanded prime and non-QM cohorts suffer from a limited amount of observations as issuance has been relatively scant until recently. We break down and evaluate the new issue market in the same manner we do the legacy market, segmenting by coupon type and position in the capital structure. We also overlay the structure onto senior bonds, segmenting them into PACs, sequentials and pass-throughs as these structures are still intact as compared to the legacy where many cash flow structures are broken as a result of depletion of credit support. Employing this taxonomy shows that the 2.0 also offers attractive risk-adjusted returns versus competing assets. Better returns have been skewed towards fixed-rate and hybrid mezzanine and subordinate cash flows, which have had annualized Sharpe ratios greater than three over the past three years. For senior investors, pass-throughs have outperformed structure on a risk-adjusted basis, with a Sharpe ratio 17% better than that of sequentials and 55% better than PAC classes of 2.0 deals. (Exhibit 4)
Exhibit 4: Comparing risk adjusted returns across new issue prime RMBS
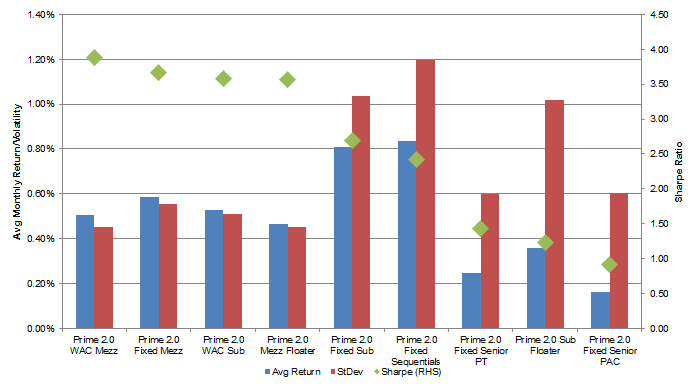
Source: IDC, Bloomberg LP, Amherst Pierpont
Another potential source of RMBS exposure is securitizations backed by seasoned re-performing loans. RPL deals are generally fairly consistent in terms of employing a sequential, excess spread structure that has historically benefitted from spread tightening as the structure de-levers and bonds get upgraded. The offset to this is that the sequential nature of the structure creates both significant interest rate and spread duration in the mezzanine and subordinate part of the capital structure which may cause these bonds to underperform in periods of pronounced and protracted volatility.
While RPL securitizations have been around for three years, large portions of the mezzanine and subordinate portions of the capital structures were retained by the issuers. As a result we can look at risk adjusted returns further up in the capital structure over a longer horizon but observations down the capital stack are less frequent. Looking at annualized risk adjusted returns across AAA through single A classes of RPL transactions over three years shows that single A RPL bonds offered the best risk adjusted returns, largely attributable to a steady grind tighter in spreads since issuance, the benefit of deleveraging and a protracted low interest rate environment. RPL single A bonds had an annualized Sharpe ratio of 1.67, 71% greater than those of AAA bonds and 26% greater than that of AA rated RPLs. Using approximately 2.5 years of monthly total returns suggest that the Sharpe ratio on BBB RPL bonds suggest they offer risk adjusted returns that are better than AAAs but slightly worse than those of AA rated bonds.
Looking at a much shorter and volatile six month horizon tells a completely different story. The shorter observation period allows us to analyzed the deals all the way down to the BB portion of the capital structure and over the past six months shorter AAA bonds have significantly outperformed the rest of the capital structure by a wide margin, suggesting that investors who believe that volatility will continue to remain elevated in 2019 may look to move to the top of the capital structure in new issue deals or rolled down mezzanine classes of seasoned transactions.
Pivoting to agency credit risk transfer bonds shows that M1 classes have offered significantly better risk adjusted returns than M2 or B classes. While all classes of CRT bonds have offered annualized Sharpe ratios greater than one over the past three years, M1 classes had a Sharpe ratio of 2.6, more than double that of M2 classes at 1.25 and significantly better than those of class B bonds which registered a Sharpe of 1.85. Away from risk adjusted returns, CRT bonds may not be an ideal out of index play for investors looking to shed corporate exposure given their historically high degree of correlation to high yield corporates.
Private label RMBS should continue to be an attractive out of index play for benchmarked investors as well as an attractive alternative to corporate exposures. Legacy and new issue mezzanine bonds should continue to offer attractive risk adjusted returns with the caveat that investors may have difficulty gaining significant scale quickly as a stand-alone strategy. A more sizable but still effective strategy may be to combine mezzanine cash flows with shorter duration RPL and non-QM AAA bonds.