Uncategorized
Fade the fall in inflation expectations
admin | December 14, 2018
This material is a Marketing Communication and does not constitute Independent Investment Research.
The most surprising shift in fixed income markets this fall—more surprising than the flattening yield curve or wider spreads—has been the sharp drop in implied inflation. The rate implied by the yield spread between 10-year Treasury notes and TIPS has dropped 35 bp since September and now hovers just above 1.8%. Either the Fed has lost some credibility or the market expects recession. Neither seems likely. Longer rates consequently seem biased higher.
Exhibit 1: A 35 bp drop in implied 10-year inflation since September
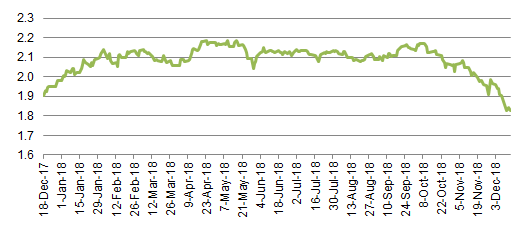
Source: Bloomberg, APS calculations
Of the leading possible explanations for a drop in 10-year implied inflation, the Fed’s commitment to a 2% target seems the least plausible. Fed inflation targeting is now as explicit as it has ever been, and the Fed’s tools for getting inflation to target more extensive than ever. The Fed has gone from implicit targeting in the 2000s to explicit targeting of 2% in this decade. Statements from FOMC governors and papers from Fed staff are full of discussions of the means for hitting that target. Former Chairman Bernanke has written extensively about letting inflation run above 2% for extended periods so the Fed can deliver 2% even after periods below that mark. And Quantitative Easing, once the purview of academic papers, is now tested. It’s hard to doubt the commitment.
It might be possible to doubt ability since the Fed struggled to get inflation to target for long stretches since the 2008 financial crisis. That increasingly looks like special circumstances. The flow of new and returning workers into the labor force certainly seemed to hold down wage inflation as they replaced older workers that earned more money. The recently named president of the San Francisco Fed has commented on this here. In a service economy, wage inflation matters. That vulnerability for monetary policy should fade over long horizons.
As for a sustained recession that might force the Fed to fight low inflation again while close to the zero lower bound in interest rates, that seems like a low probability. Economic growth does look likely to slow from the pace of 2018 as the impact of discretionary government spending fades. But moderating growth does not mean recession.
Since wider spreads in risk assets has done some of the Fed’s work, look for the December 19 FOMC to show a lower path for the policy dots. Inflation expectations should bounce higher, and long rates along with them.
* * *
The view in financing
Secured lending or repo rates continue to face upward pressure from a heavy flow of new Treasury debt that needs financing and bloated primary dealer balance sheets and investor positions that need financing, too. Essentially, year end pressure is being exacerbated from this financing demand. The turn—funding from December 31 to January 2—trades at 3.00% for MBS collateral and 2.97% for Treasury collateral. Short periods over year end are priced with the same pressure with MBS funding Class A (December to January) at 2.68%. The pressure persists despite the cash from slightly less than $100 billion of Treasury bills maturing over the next five weeks. After the turn, funding markets likely will focus on a rate regime bearing the markets of a December 19 Fed hike of 25 bp and a bump up in IOER of 20 bp.
The view in rates
The Fed’s dots offered a simple guide to the likely path of shorter rates for most of the year, but the tightening of financial conditions since September has started doing some of the Fed’s work. The Fed dots should change on December 19. That leaves fair value in 10-year rates around 3.0%. From current levels around 2.90%, look for rates to bounce higher.
The view in spreads
Credit spreads should continue widening until they have priced fully for decelerating growth next. Slower growth poses risk to the nearly $3 trillion in ‘BBB’ credit, especially the most highly leveraged names. Names that show organic growth or use free cash flow or asset sales to pay down debt should perform the best. Wider spreads in corporate credit should put pressure on other spread assets, although consumer debt should show less volatility. Agency MBS, which also will need to adjust to likely falling bank appetite, should widen, too.
The view in credit
Although corporate balance sheets have to deal with higher leverage, household balance sheets looks strong. The weakest pockets on the household balance sheet look like subprime auto credit and student loan debt.
This material is intended only for institutional investors and does not carry all of the independence and disclosure standards of retail debt research reports. In the preparation of this material, the author may have consulted or otherwise discussed the matters referenced herein with one or more of SCM’s trading desks, any of which may have accumulated or otherwise taken a position, long or short, in any of the financial instruments discussed in or related to this material. Further, SCM may act as a market maker or principal dealer and may have proprietary interests that differ or conflict with the recipient hereof, in connection with any financial instrument discussed in or related to this material.
This message, including any attachments or links contained herein, is subject to important disclaimers, conditions, and disclosures regarding Electronic Communications, which you can find at https://portfolio-strategy.apsec.com/sancap-disclaimers-and-disclosures.
Important Disclaimers
Copyright © 2026 Santander US Capital Markets LLC and its affiliates (“SCM”). All rights reserved. SCM is a member of FINRA and SIPC. This material is intended for limited distribution to institutions only and is not publicly available. Any unauthorized use or disclosure is prohibited.
In making this material available, SCM (i) is not providing any advice to the recipient, including, without limitation, any advice as to investment, legal, accounting, tax and financial matters, (ii) is not acting as an advisor or fiduciary in respect of the recipient, (iii) is not making any predictions or projections and (iv) intends that any recipient to which SCM has provided this material is an “institutional investor” (as defined under applicable law and regulation, including FINRA Rule 4512 and that this material will not be disseminated, in whole or part, to any third party by the recipient.
The author of this material is an economist, desk strategist or trader. In the preparation of this material, the author may have consulted or otherwise discussed the matters referenced herein with one or more of SCM’s trading desks, any of which may have accumulated or otherwise taken a position, long or short, in any of the financial instruments discussed in or related to this material. Further, SCM or any of its affiliates may act as a market maker or principal dealer and may have proprietary interests that differ or conflict with the recipient hereof, in connection with any financial instrument discussed in or related to this material.
This material (i) has been prepared for information purposes only and does not constitute a solicitation or an offer to buy or sell any securities, related investments or other financial instruments, (ii) is neither research, a “research report” as commonly understood under the securities laws and regulations promulgated thereunder nor the product of a research department, (iii) or parts thereof may have been obtained from various sources, the reliability of which has not been verified and cannot be guaranteed by SCM, (iv) should not be reproduced or disclosed to any other person, without SCM’s prior consent and (v) is not intended for distribution in any jurisdiction in which its distribution would be prohibited.
In connection with this material, SCM (i) makes no representation or warranties as to the appropriateness or reliance for use in any transaction or as to the permissibility or legality of any financial instrument in any jurisdiction, (ii) believes the information in this material to be reliable, has not independently verified such information and makes no representation, express or implied, with regard to the accuracy or completeness of such information, (iii) accepts no responsibility or liability as to any reliance placed, or investment decision made, on the basis of such information by the recipient and (iv) does not undertake, and disclaims any duty to undertake, to update or to revise the information contained in this material.
Unless otherwise stated, the views, opinions, forecasts, valuations, or estimates contained in this material are those solely of the author, as of the date of publication of this material, and are subject to change without notice. The recipient of this material should make an independent evaluation of this information and make such other investigations as the recipient considers necessary (including obtaining independent financial advice), before transacting in any financial market or instrument discussed in or related to this material.
Important disclaimers for clients in the EU and UK
This publication has been prepared by Trading Desk Strategists within the Sales and Trading functions of Santander US Capital Markets LLC (“SanCap”), the US registered broker-dealer of Santander Corporate & Investment Banking. This communication is distributed in the EEA by Banco Santander S.A., a credit institution registered in Spain and authorised and regulated by the Bank of Spain and the CNMV. Any EEA recipient of this communication that would like to affect any transaction in any security or issuer discussed herein should do so with Banco Santander S.A. or any of its affiliates (together “Santander”). This communication has been distributed in the UK by Banco Santander, S.A.’s London branch, authorised by the Bank of Spain and subject to regulatory oversight on certain matters by the Financial Conduct Authority (FCA) and the Prudential Regulation Authority (PRA).
The publication is intended for exclusive use for Professional Clients and Eligible Counterparties as defined by MiFID II and is not intended for use by retail customers or for any persons or entities in any jurisdictions or country where such distribution or use would be contrary to local law or regulation.
This material is not a product of Santander´s Research Team and does not constitute independent investment research. This is a marketing communication and may contain ¨investment recommendations¨ as defined by the Market Abuse Regulation 596/2014 ("MAR"). This publication has not been prepared in accordance with legal requirements designed to promote the independence of research and is not subject to any prohibition on dealing ahead of the dissemination of investment research. The author, date and time of the production of this publication are as indicated herein.
This publication does not constitute investment advice and may not be relied upon to form an investment decision, nor should it be construed as any offer to sell or issue or invitation to purchase, acquire or subscribe for any instruments referred herein. The publication has been prepared in good faith and based on information Santander considers reliable as of the date of publication, but Santander does not guarantee or represent, express or implied, that such information is accurate or complete. All estimates, forecasts and opinions are current as at the date of this publication and are subject to change without notice. Unless otherwise indicated, Santander does not intend to update this publication. The views and commentary in this publication may not be objective or independent of the interests of the Trading and Sales functions of Santander, who may be active participants in the markets, investments or strategies referred to herein and/or may receive compensation from investment banking and non-investment banking services from entities mentioned herein. Santander may trade as principal, make a market or hold positions in instruments (or related derivatives) and/or hold financial interest in entities discussed herein. Santander may provide market commentary or trading strategies to other clients or engage in transactions which may differ from views expressed herein. Santander may have acted upon the contents of this publication prior to you having received it.
This publication is intended for the exclusive use of the recipient and must not be reproduced, redistributed or transmitted, in whole or in part, without Santander’s consent. The recipient agrees to keep confidential at all times information contained herein.


