Uncategorized
A return to rebuilding balance sheets
admin | December 7, 2018
This material is a Marketing Communication and does not constitute Independent Investment Research.
As rates rise and funding becomes more expensive, balance sheet health is finally coming back into play for issuers in the consumer, retail and telecom-media-technology sectors. Volatility has slowly crept back into the market as credits such as GE and PCG underscore the importance of liquidity and the ability to refinance. With the added volatility and some long-awaited dislocations in the credit market, 2019 should mark a turn from broadly passive investing to relative value. The strongest names will likely rely on organic growth, asset sales and other methods to rebuild balance sheets.
This new focus follows from a 2018 that can be summarized in a few words: heavy issuance and highly technical. Mega M&A deals such as CVS’ purchase of AET and CMCSA’s purchase of the Sky assets led to two of the five largest corporate bonds deals in history. While the packaged food/beverage space struggled to grow organically, they too looked to mergers to fuel growth and tapped the market to fund the deals. Investment grade issuance, while trailing last year’s number year to date, is still expected to end the year around the $1.2 trillion compared to $1.37 trillion in 2017.
Back to the basics: balance sheets, credit profiles and relative value
Balance sheets and strong credit profiles should largely be a catalyst for the better performers in 2019. After a few years of gorging on acquisitions or financing shareholder rewards with debt, balance sheets have become bloated. With organic growth hard to come by, management teams have been willing to forgo ratings and use debt to fuel growth and support equity prices. So much so, that the BBB ratings category has grown to over 50% of the index today, relative to 31% in 2010. All of this happened in a low rate, low volatility environment as an influx of capital continued to pour into the market. This inevitably produced very little spread dislocation among rating categories. Only names that deemed to have fallen angel potential seemed to be the trading outliers. With the added volatility in the market, the beginnings of spread differentiation are beginning to emerge, thereby bringing relative value back to credit picking. As investors look for alpha in 2019 and try to avoid the potential for credit blow ups, balance sheet strength and strong credit profiles will likely be rewarded.
M&A should continue albeit at a slower pace
While M&A should continue in 2019, the pace of large-scale acquisitions should slow. M&A has been used to fuel growth over the past few years as organic growth remained muted. While organic growth doesn’t look likely to improve much in 2019, Best Buy and Verizon are prime examples where reinvestment in the business and innovation can successfully address growth and competition issues at a far lower price tag than M&A. Both credits outperformed peers considerably this year from a sales perspective. Without the additional debt from large acquisitions, BBY has positive ratings momentum while VZ remains rated one notch higher at Moody’s and S&P relative to AT&T.
From acquisitions to divestitures
Fears that the consumer pulls back and growth slows could pressure free cash flow forecasts and prolong debt reduction from acquisitions. Furthermore, any fallout from GE regarding refinancing and delevering risk could put pressure on management teams to look for other levers to pull to reduce debt. That said, the pace of divestitures could pick up in order to bring in proceeds for debt reduction. NWL is in the process of raising $10 billion through asset sales as part of their Accelerated Transformation Plan after their acquisition of Jarden. While CPB recently announced that it will be looking to shed its International and Fresh businesses with proceeds going to debt reduction after closing on the Snyder’s acquisition. AT&T noted at its analyst day that in addition to the $12 billion in free cash flow they expect to put to debt reduction in 2019, they are looking at roughly $6 billion to $8 billion in asset sale proceeds to help speed up debt reduction from the TWX acquisition. This would bring leverage down roughly three ticks from the expected 2.8x net leverage at the end of 2018.
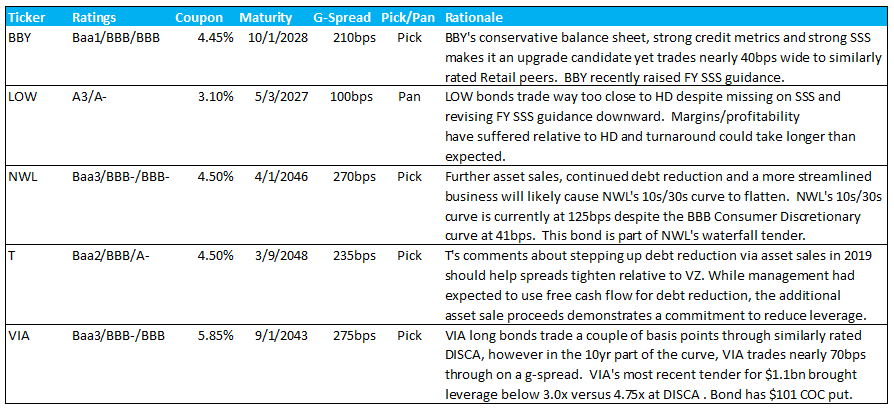
Picks and Pans
This material is intended only for institutional investors and does not carry all of the independence and disclosure standards of retail debt research reports. In the preparation of this material, the author may have consulted or otherwise discussed the matters referenced herein with one or more of SCM’s trading desks, any of which may have accumulated or otherwise taken a position, long or short, in any of the financial instruments discussed in or related to this material. Further, SCM may act as a market maker or principal dealer and may have proprietary interests that differ or conflict with the recipient hereof, in connection with any financial instrument discussed in or related to this material.
This message, including any attachments or links contained herein, is subject to important disclaimers, conditions, and disclosures regarding Electronic Communications, which you can find at https://portfolio-strategy.apsec.com/sancap-disclaimers-and-disclosures.
Important Disclaimers
Copyright © 2026 Santander US Capital Markets LLC and its affiliates (“SCM”). All rights reserved. SCM is a member of FINRA and SIPC. This material is intended for limited distribution to institutions only and is not publicly available. Any unauthorized use or disclosure is prohibited.
In making this material available, SCM (i) is not providing any advice to the recipient, including, without limitation, any advice as to investment, legal, accounting, tax and financial matters, (ii) is not acting as an advisor or fiduciary in respect of the recipient, (iii) is not making any predictions or projections and (iv) intends that any recipient to which SCM has provided this material is an “institutional investor” (as defined under applicable law and regulation, including FINRA Rule 4512 and that this material will not be disseminated, in whole or part, to any third party by the recipient.
The author of this material is an economist, desk strategist or trader. In the preparation of this material, the author may have consulted or otherwise discussed the matters referenced herein with one or more of SCM’s trading desks, any of which may have accumulated or otherwise taken a position, long or short, in any of the financial instruments discussed in or related to this material. Further, SCM or any of its affiliates may act as a market maker or principal dealer and may have proprietary interests that differ or conflict with the recipient hereof, in connection with any financial instrument discussed in or related to this material.
This material (i) has been prepared for information purposes only and does not constitute a solicitation or an offer to buy or sell any securities, related investments or other financial instruments, (ii) is neither research, a “research report” as commonly understood under the securities laws and regulations promulgated thereunder nor the product of a research department, (iii) or parts thereof may have been obtained from various sources, the reliability of which has not been verified and cannot be guaranteed by SCM, (iv) should not be reproduced or disclosed to any other person, without SCM’s prior consent and (v) is not intended for distribution in any jurisdiction in which its distribution would be prohibited.
In connection with this material, SCM (i) makes no representation or warranties as to the appropriateness or reliance for use in any transaction or as to the permissibility or legality of any financial instrument in any jurisdiction, (ii) believes the information in this material to be reliable, has not independently verified such information and makes no representation, express or implied, with regard to the accuracy or completeness of such information, (iii) accepts no responsibility or liability as to any reliance placed, or investment decision made, on the basis of such information by the recipient and (iv) does not undertake, and disclaims any duty to undertake, to update or to revise the information contained in this material.
Unless otherwise stated, the views, opinions, forecasts, valuations, or estimates contained in this material are those solely of the author, as of the date of publication of this material, and are subject to change without notice. The recipient of this material should make an independent evaluation of this information and make such other investigations as the recipient considers necessary (including obtaining independent financial advice), before transacting in any financial market or instrument discussed in or related to this material.
Important disclaimers for clients in the EU and UK
This publication has been prepared by Trading Desk Strategists within the Sales and Trading functions of Santander US Capital Markets LLC (“SanCap”), the US registered broker-dealer of Santander Corporate & Investment Banking. This communication is distributed in the EEA by Banco Santander S.A., a credit institution registered in Spain and authorised and regulated by the Bank of Spain and the CNMV. Any EEA recipient of this communication that would like to affect any transaction in any security or issuer discussed herein should do so with Banco Santander S.A. or any of its affiliates (together “Santander”). This communication has been distributed in the UK by Banco Santander, S.A.’s London branch, authorised by the Bank of Spain and subject to regulatory oversight on certain matters by the Financial Conduct Authority (FCA) and the Prudential Regulation Authority (PRA).
The publication is intended for exclusive use for Professional Clients and Eligible Counterparties as defined by MiFID II and is not intended for use by retail customers or for any persons or entities in any jurisdictions or country where such distribution or use would be contrary to local law or regulation.
This material is not a product of Santander´s Research Team and does not constitute independent investment research. This is a marketing communication and may contain ¨investment recommendations¨ as defined by the Market Abuse Regulation 596/2014 ("MAR"). This publication has not been prepared in accordance with legal requirements designed to promote the independence of research and is not subject to any prohibition on dealing ahead of the dissemination of investment research. The author, date and time of the production of this publication are as indicated herein.
This publication does not constitute investment advice and may not be relied upon to form an investment decision, nor should it be construed as any offer to sell or issue or invitation to purchase, acquire or subscribe for any instruments referred herein. The publication has been prepared in good faith and based on information Santander considers reliable as of the date of publication, but Santander does not guarantee or represent, express or implied, that such information is accurate or complete. All estimates, forecasts and opinions are current as at the date of this publication and are subject to change without notice. Unless otherwise indicated, Santander does not intend to update this publication. The views and commentary in this publication may not be objective or independent of the interests of the Trading and Sales functions of Santander, who may be active participants in the markets, investments or strategies referred to herein and/or may receive compensation from investment banking and non-investment banking services from entities mentioned herein. Santander may trade as principal, make a market or hold positions in instruments (or related derivatives) and/or hold financial interest in entities discussed herein. Santander may provide market commentary or trading strategies to other clients or engage in transactions which may differ from views expressed herein. Santander may have acted upon the contents of this publication prior to you having received it.
This publication is intended for the exclusive use of the recipient and must not be reproduced, redistributed or transmitted, in whole or in part, without Santander’s consent. The recipient agrees to keep confidential at all times information contained herein.


