Uncategorized
Shifting demand, rising cap rates, some regulator risk
admin | November 30, 2018
This material is a Marketing Communication and does not constitute Independent Investment Research.
New bank liquidity rules, modest risk for multifamily property valuations and a new director at the Federal Housing Finance Agency all look likely to shape the agency CMBS market next year. Banks hold the majority of the outstanding market, and their likely lower marginal appetite should have the biggest impact on spreads. Valuations present modest risks for supply and prepayments. A new director at FHFA could shrink the enterprise footprint. Agency CMBS should perform well relative to private CMBS, and conventional agency CMBS should do well against Ginnie Mae.
***
New bank liquidity rules could weaken demand for agency CMBS
Since banks hold the majority of agency CMBS, the Fed’s recent proposal to loosen bank liquidity rules looks like a negative for spreads—especially for Ginnie Mae project loans. The Fed has proposed eliminating the liquidity coverage ratio (LCR) for banks between $50 billion and $250 billion in total assets and easing LCR rules for banks in the $250 billion to $700 billion range. A complete analysis of the impact of the rule changes is here. One takeaway is that the easing of requirements could materially reduce the need for banks to hold agency CMBS, which qualify as high quality liquid assets and help banks cover LCR requirements. This is especially true for full faith and credit instruments such as Ginnie Mae project loans. Much of the more than $250 billion in current bank holdings in agency CMBS sit in held-to-maturity portfolios, so it is unlikely that there will be significant liquidation of the positions. But banks affected by the proposed rules may be inclined to pull back on high quality liquid assets in favor of securities or loans with higher yield. Bank sponsorship of agency CMBS looks likely to soften. But wider spreads would likely draw interest from the sector’s second largest set of investors, money managers, cushioning the impact of any shift in bank demand.
Exhibit 1: Bank demand dominates the market
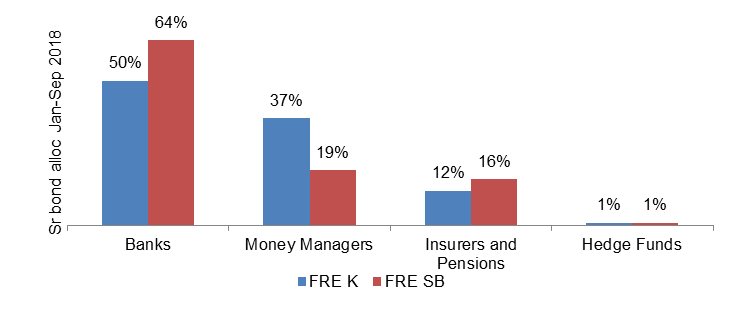
Source: Freddie Mac
Higher rates present a risk to property valuations
Low interest rates, tight spreads and a broad trend toward renting instead of owning has helped apartment building cap rates tighten steadily since 2009—even as rates on office and industrial properties over the last 18 months have softened. Multifamily may finally see higher cap rates in 2019. Higher interest rates could create some modest pressure next year, but the odds of a sharp rise in rates looks low. Even if rates drift higher next year, rising rents could buffer the impact on cap rates. Rates on single-family properties, a proxy for multifamily, have been rising between 3.5% and 4.0% since early 2017, a pace that would slow any rise in cap rates driven by interest rates alone. But the bigger issue is demand for multifamily housing. A rebound in US homeownership rates since 2016 has softened demand for multifamily housing, at least as reflected by declining multifamily permits and multifamily starts. That could soften rent growth broadly. More specifically, almost 25% of new construction has come in just five markets, according to Fannie Mae – Los Angeles, New York, Boston, San Francisco and Washington DC – which have above-average rent growth. It’s unclear whether these markets can absorb that much supply without rent rolls decelerating, which present a risk to property valuations. Weaker valuations would likely limit supply somewhat, but also lower voluntary prepayments.
Exhibit 2: A rebound in homeownership could help soften MF cap rates
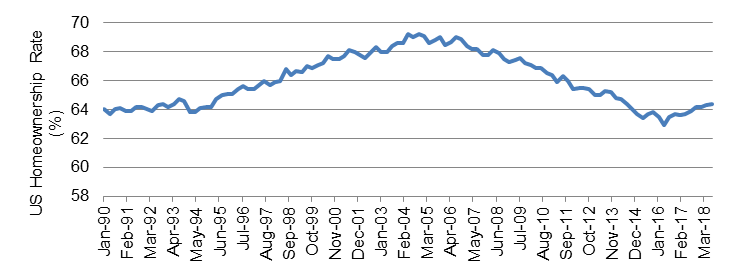
Source: US Bureau of the Census via FRED
New FHFA director could shrink GSE footprint to attract private capital
Mel Watt, current director of the Federal Housing Finance Agency, leaves office in January and opens the door to changes in all related policy, including Fannie mae and Freddie Mac multifamily. Multifamily lending caps for 2018 and 2019 are $35 billion for each enterprise, down from $36.5 billion in 2017. The FHFA director bases the caps on projections for the overall size of the multifamily loan originations market. Excluded from the caps are loans in the affordable or underserved market segments, whose criteria are based the percentage of units with rents affordable to those at or below a stated percentage of the area median income. For example, in 2018 the FHFA added an extremely high cost market category, where units affordable to those at or below 120% of the AMI were eligible for exclusion from the cap on a pro-rata basis. This designation has been revised for 2019, with FHFA stating they have developed a data-driven approach to designate markets in which “units affordable to cost-burdened renters at certain area median income levels will be excluded from the multifamily cap on a pro-rata basis.” Additional details will be provided in the 2019 scorecard, which has yet to be released.
While the GSEs remain under conservatorship, the FHFA director has nearly unfettered power to restructure the business lines. There is considerable speculation that a new Trump-appointed director may endeavor to shrink the footprint of the GSEs. One direct method for shrinking the footprint of the GSEs in the multifamily space, and to encourage the participation of private capital, would be to work with HUD to revise the definition of allowable area median income (AMI), lower the caps on origination, or narrow the conditions for what can be excluded since most of the current origination falls outside of the caps.
Before the crisis the GSEs were bankrolling about a third of all multifamily loans. Their market share exploded to nearly 70% after the crisis, but drifted back down to 30% as private funding for apartments became more available. Under FHFA director Mel Watt, who began his tenure in 2014, the GSEs multifamily market share began growing rapidly again. In 2017 the GSEs financed a total of $140 billion in the multifamily space, roughly 53% of the total multifamily mortgage market, which was estimated at $264 billion by the Mortgage Bankers Association.
Probability that new issue supply shrinks due to some combination of higher rates, wider credit spreads and a new FHFA director: 80%. Probability that the reduction in supply is capable of offsetting lower bank demand, a marginal drag on property valuations and a broader re-pricing of credit: 30%.
The trade: Overweight agency CMBS against private CMBS. Overweight conventional agency CMBS against Ginnie Mae project loans.
This material is intended only for institutional investors and does not carry all of the independence and disclosure standards of retail debt research reports. In the preparation of this material, the author may have consulted or otherwise discussed the matters referenced herein with one or more of SCM’s trading desks, any of which may have accumulated or otherwise taken a position, long or short, in any of the financial instruments discussed in or related to this material. Further, SCM may act as a market maker or principal dealer and may have proprietary interests that differ or conflict with the recipient hereof, in connection with any financial instrument discussed in or related to this material.
This message, including any attachments or links contained herein, is subject to important disclaimers, conditions, and disclosures regarding Electronic Communications, which you can find at https://portfolio-strategy.apsec.com/sancap-disclaimers-and-disclosures.
Important Disclaimers
Copyright © 2026 Santander US Capital Markets LLC and its affiliates (“SCM”). All rights reserved. SCM is a member of FINRA and SIPC. This material is intended for limited distribution to institutions only and is not publicly available. Any unauthorized use or disclosure is prohibited.
In making this material available, SCM (i) is not providing any advice to the recipient, including, without limitation, any advice as to investment, legal, accounting, tax and financial matters, (ii) is not acting as an advisor or fiduciary in respect of the recipient, (iii) is not making any predictions or projections and (iv) intends that any recipient to which SCM has provided this material is an “institutional investor” (as defined under applicable law and regulation, including FINRA Rule 4512 and that this material will not be disseminated, in whole or part, to any third party by the recipient.
The author of this material is an economist, desk strategist or trader. In the preparation of this material, the author may have consulted or otherwise discussed the matters referenced herein with one or more of SCM’s trading desks, any of which may have accumulated or otherwise taken a position, long or short, in any of the financial instruments discussed in or related to this material. Further, SCM or any of its affiliates may act as a market maker or principal dealer and may have proprietary interests that differ or conflict with the recipient hereof, in connection with any financial instrument discussed in or related to this material.
This material (i) has been prepared for information purposes only and does not constitute a solicitation or an offer to buy or sell any securities, related investments or other financial instruments, (ii) is neither research, a “research report” as commonly understood under the securities laws and regulations promulgated thereunder nor the product of a research department, (iii) or parts thereof may have been obtained from various sources, the reliability of which has not been verified and cannot be guaranteed by SCM, (iv) should not be reproduced or disclosed to any other person, without SCM’s prior consent and (v) is not intended for distribution in any jurisdiction in which its distribution would be prohibited.
In connection with this material, SCM (i) makes no representation or warranties as to the appropriateness or reliance for use in any transaction or as to the permissibility or legality of any financial instrument in any jurisdiction, (ii) believes the information in this material to be reliable, has not independently verified such information and makes no representation, express or implied, with regard to the accuracy or completeness of such information, (iii) accepts no responsibility or liability as to any reliance placed, or investment decision made, on the basis of such information by the recipient and (iv) does not undertake, and disclaims any duty to undertake, to update or to revise the information contained in this material.
Unless otherwise stated, the views, opinions, forecasts, valuations, or estimates contained in this material are those solely of the author, as of the date of publication of this material, and are subject to change without notice. The recipient of this material should make an independent evaluation of this information and make such other investigations as the recipient considers necessary (including obtaining independent financial advice), before transacting in any financial market or instrument discussed in or related to this material.
Important disclaimers for clients in the EU and UK
This publication has been prepared by Trading Desk Strategists within the Sales and Trading functions of Santander US Capital Markets LLC (“SanCap”), the US registered broker-dealer of Santander Corporate & Investment Banking. This communication is distributed in the EEA by Banco Santander S.A., a credit institution registered in Spain and authorised and regulated by the Bank of Spain and the CNMV. Any EEA recipient of this communication that would like to affect any transaction in any security or issuer discussed herein should do so with Banco Santander S.A. or any of its affiliates (together “Santander”). This communication has been distributed in the UK by Banco Santander, S.A.’s London branch, authorised by the Bank of Spain and subject to regulatory oversight on certain matters by the Financial Conduct Authority (FCA) and the Prudential Regulation Authority (PRA).
The publication is intended for exclusive use for Professional Clients and Eligible Counterparties as defined by MiFID II and is not intended for use by retail customers or for any persons or entities in any jurisdictions or country where such distribution or use would be contrary to local law or regulation.
This material is not a product of Santander´s Research Team and does not constitute independent investment research. This is a marketing communication and may contain ¨investment recommendations¨ as defined by the Market Abuse Regulation 596/2014 ("MAR"). This publication has not been prepared in accordance with legal requirements designed to promote the independence of research and is not subject to any prohibition on dealing ahead of the dissemination of investment research. The author, date and time of the production of this publication are as indicated herein.
This publication does not constitute investment advice and may not be relied upon to form an investment decision, nor should it be construed as any offer to sell or issue or invitation to purchase, acquire or subscribe for any instruments referred herein. The publication has been prepared in good faith and based on information Santander considers reliable as of the date of publication, but Santander does not guarantee or represent, express or implied, that such information is accurate or complete. All estimates, forecasts and opinions are current as at the date of this publication and are subject to change without notice. Unless otherwise indicated, Santander does not intend to update this publication. The views and commentary in this publication may not be objective or independent of the interests of the Trading and Sales functions of Santander, who may be active participants in the markets, investments or strategies referred to herein and/or may receive compensation from investment banking and non-investment banking services from entities mentioned herein. Santander may trade as principal, make a market or hold positions in instruments (or related derivatives) and/or hold financial interest in entities discussed herein. Santander may provide market commentary or trading strategies to other clients or engage in transactions which may differ from views expressed herein. Santander may have acted upon the contents of this publication prior to you having received it.
This publication is intended for the exclusive use of the recipient and must not be reproduced, redistributed or transmitted, in whole or in part, without Santander’s consent. The recipient agrees to keep confidential at all times information contained herein.


