Uncategorized
Likely return and risk shift but remain attractive
admin | November 30, 2018
This material is a Marketing Communication and does not constitute Independent Investment Research.
The leveraged loan market looks likely to come under some of the same pressure as other parts of the credit markets next year as rates edge up and concerns about US economic growth build. Performance relative to other major asset classes should weaken, but it would have to weaken dramatically to become a drag on portfolio performance. Rising rates could be a clear pressure point since the $1.1 trillion market largely floats off of 1- and 3-month LIBOR. And managers could see their limits on ‘CCC’ credits tested. Going higher in CLO capital structure, shorter in weighted average life and away from exposures to cyclical sectors should help.
* * *
Shifting but continuing relative value
Even though leveraged loans may struggle next year to match their performance of the last few, they still should turn in some of the market’s better risk-adjusted returns—returns investors can either leverage or deleverage in CLOs. Average annual return on loans have run around 4.5% over the last decade with an annual standard deviation of 3.0%, one of the better combinations among major asset classes (Exhibit 1A). Those numbers mask significant year-to-year variation, of course, but even in the 5-year window bracketing the crisis years of 2008 and 2009, leveraged loans finished second only to agency MBS. Since 2013, performance has topped other major assets. Loans also have shown low correlation to other assets, adding to potential value as part of a portfolio (Exhibit 1B). Loans nevertheless look unlikely to match their recent strong performance over the next few years for a number of reasons: among others, exposure to rising rates and a potentially decelerating economy, an 80% share for covenant-lite loans in this year’s issuance and a 28% share for loans from M&A that rely on future projected revenue gains or cost savings. Both the return and volatility gaps between leveraged loans other assets look set to shrink in coming years. Leveraged loans still should play an important portfolio role, especially as a better source of corporate credit exposure than large parts of the investment grade market.
Probability that leveraged loan performance weakens against agency MBS or ABS: 60%. Probability that performance weakens against investment grade corporate debt: 20%.
The trade: Deleverage exposure to loan performance by going up in the CLO capital structure.
Exhibit 1: Leveraged loan performance should fall below historic levels next year but still remain attractive
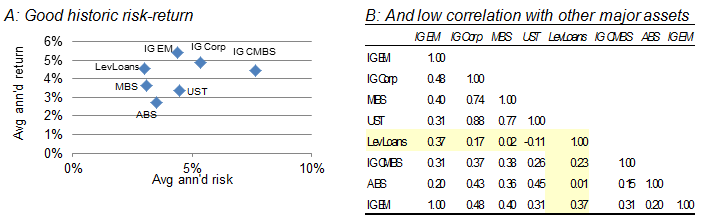
Note: returns March 2007 to October 2018. Source: S&P/LSTA index for leveraged loans, Bloomberg/Barclays indices for other assets, APS calculations.
The risk of rising rates
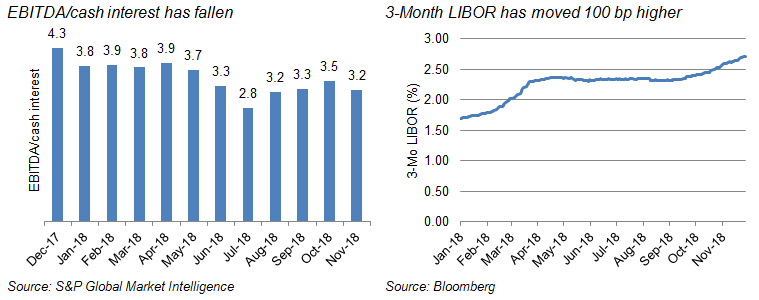
Since almost all of the $1.1 trillion leveraged loan market floats off of 1- or 3-month LIBOR, this market more than any other in corporate credit could feel the pinch of higher interest rates. With 3-month LIBOR already up 100 bp this year, the process has already started. Gross cash flow for the average leveraged borrower stood at 4.3x the interest expense at the start of this year but only 3.2x recently (Exhibit 2). Another 50 bp rise in 3-month LIBOR without a lift in gross earnings could drive the ratio below 3.0x, a level historically associated with rising leveraged loan defaults within two years. Higher earnings could offset higher interest expense, of course, but that should depend on continued robust economic growth. The market could get caught between a Fed focused on raising rates to fight inflation on the one hand and decelerating economic growth on the other. Amid other pressures on CLO spreads—from wider investment grade and high yield spreads to slightly wider spreads in MBS—concern about leveraged loan credit could add to the mix.
Probability of a 50 bp or higher move in 3-month LIBOR: 25%. Probability of average EBITDA/cash interest falling below 3.0: 10%
The trade: move higher in the CLO capital structure, move to CLOs with shorter expected average lives, or do both to limit spread exposure. Move away from CLOs with heavy exposure to sectors sensitive to rising rates and slower growth such as energy, commodities and consumer discretionary.
Exhibit 2: Interest coverage has dropped this year as rates have moved up
Pressure on ‘CCC’ limits
The amount of ‘CCC’ CLO collateral has ranged from 3% to 4% over the last year, well under the typical 5.0% to 7.5% limit for ‘CCC’ exposure in most CLOs. And the number of CLOs failing this test also has drifted down. But the leveraged loan market in general could see a material pick up in ‘CCC’ loans if higher rates, a slowing economy or both put a squeeze on balance sheets. Around 9% of outstanding leveraged loans currently have a ‘B-‘ S&P rating and another nearly 28% have a ‘B’ rating (Exhibit 3). Modest pressure on these loans could quickly drive ‘CCC’ exposure in some CLOs above allowable levels, forcing the deal manager to haircut the loan to market value and putting pressure on par overcollateralization tests.
Probability of a rise in ‘CCC’ CLO exposure above deal limits: 10%
The trade: move higher in the CLO capital structure, move to CLOs with shorter expected average lives, or do both to limit spread exposure. Move away from CLOs with heavy exposure to sectors sensitive to rising rates and slower growth such as energy, commodities and consumer discretionary.
Exhibit 3: Pressure on ‘B-‘ loans could push CLOs toward limits on ‘CCC’ debt
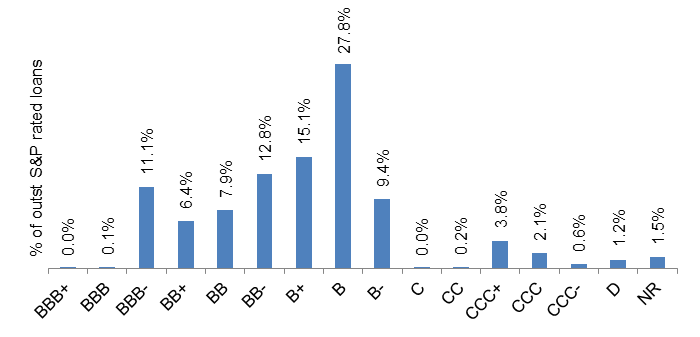
Source: S&P Global Market Intelligence
This material is intended only for institutional investors and does not carry all of the independence and disclosure standards of retail debt research reports. In the preparation of this material, the author may have consulted or otherwise discussed the matters referenced herein with one or more of SCM’s trading desks, any of which may have accumulated or otherwise taken a position, long or short, in any of the financial instruments discussed in or related to this material. Further, SCM may act as a market maker or principal dealer and may have proprietary interests that differ or conflict with the recipient hereof, in connection with any financial instrument discussed in or related to this material.
This message, including any attachments or links contained herein, is subject to important disclaimers, conditions, and disclosures regarding Electronic Communications, which you can find at https://portfolio-strategy.apsec.com/sancap-disclaimers-and-disclosures.
Important Disclaimers
Copyright © 2026 Santander US Capital Markets LLC and its affiliates (“SCM”). All rights reserved. SCM is a member of FINRA and SIPC. This material is intended for limited distribution to institutions only and is not publicly available. Any unauthorized use or disclosure is prohibited.
In making this material available, SCM (i) is not providing any advice to the recipient, including, without limitation, any advice as to investment, legal, accounting, tax and financial matters, (ii) is not acting as an advisor or fiduciary in respect of the recipient, (iii) is not making any predictions or projections and (iv) intends that any recipient to which SCM has provided this material is an “institutional investor” (as defined under applicable law and regulation, including FINRA Rule 4512 and that this material will not be disseminated, in whole or part, to any third party by the recipient.
The author of this material is an economist, desk strategist or trader. In the preparation of this material, the author may have consulted or otherwise discussed the matters referenced herein with one or more of SCM’s trading desks, any of which may have accumulated or otherwise taken a position, long or short, in any of the financial instruments discussed in or related to this material. Further, SCM or any of its affiliates may act as a market maker or principal dealer and may have proprietary interests that differ or conflict with the recipient hereof, in connection with any financial instrument discussed in or related to this material.
This material (i) has been prepared for information purposes only and does not constitute a solicitation or an offer to buy or sell any securities, related investments or other financial instruments, (ii) is neither research, a “research report” as commonly understood under the securities laws and regulations promulgated thereunder nor the product of a research department, (iii) or parts thereof may have been obtained from various sources, the reliability of which has not been verified and cannot be guaranteed by SCM, (iv) should not be reproduced or disclosed to any other person, without SCM’s prior consent and (v) is not intended for distribution in any jurisdiction in which its distribution would be prohibited.
In connection with this material, SCM (i) makes no representation or warranties as to the appropriateness or reliance for use in any transaction or as to the permissibility or legality of any financial instrument in any jurisdiction, (ii) believes the information in this material to be reliable, has not independently verified such information and makes no representation, express or implied, with regard to the accuracy or completeness of such information, (iii) accepts no responsibility or liability as to any reliance placed, or investment decision made, on the basis of such information by the recipient and (iv) does not undertake, and disclaims any duty to undertake, to update or to revise the information contained in this material.
Unless otherwise stated, the views, opinions, forecasts, valuations, or estimates contained in this material are those solely of the author, as of the date of publication of this material, and are subject to change without notice. The recipient of this material should make an independent evaluation of this information and make such other investigations as the recipient considers necessary (including obtaining independent financial advice), before transacting in any financial market or instrument discussed in or related to this material.
Important disclaimers for clients in the EU and UK
This publication has been prepared by Trading Desk Strategists within the Sales and Trading functions of Santander US Capital Markets LLC (“SanCap”), the US registered broker-dealer of Santander Corporate & Investment Banking. This communication is distributed in the EEA by Banco Santander S.A., a credit institution registered in Spain and authorised and regulated by the Bank of Spain and the CNMV. Any EEA recipient of this communication that would like to affect any transaction in any security or issuer discussed herein should do so with Banco Santander S.A. or any of its affiliates (together “Santander”). This communication has been distributed in the UK by Banco Santander, S.A.’s London branch, authorised by the Bank of Spain and subject to regulatory oversight on certain matters by the Financial Conduct Authority (FCA) and the Prudential Regulation Authority (PRA).
The publication is intended for exclusive use for Professional Clients and Eligible Counterparties as defined by MiFID II and is not intended for use by retail customers or for any persons or entities in any jurisdictions or country where such distribution or use would be contrary to local law or regulation.
This material is not a product of Santander´s Research Team and does not constitute independent investment research. This is a marketing communication and may contain ¨investment recommendations¨ as defined by the Market Abuse Regulation 596/2014 ("MAR"). This publication has not been prepared in accordance with legal requirements designed to promote the independence of research and is not subject to any prohibition on dealing ahead of the dissemination of investment research. The author, date and time of the production of this publication are as indicated herein.
This publication does not constitute investment advice and may not be relied upon to form an investment decision, nor should it be construed as any offer to sell or issue or invitation to purchase, acquire or subscribe for any instruments referred herein. The publication has been prepared in good faith and based on information Santander considers reliable as of the date of publication, but Santander does not guarantee or represent, express or implied, that such information is accurate or complete. All estimates, forecasts and opinions are current as at the date of this publication and are subject to change without notice. Unless otherwise indicated, Santander does not intend to update this publication. The views and commentary in this publication may not be objective or independent of the interests of the Trading and Sales functions of Santander, who may be active participants in the markets, investments or strategies referred to herein and/or may receive compensation from investment banking and non-investment banking services from entities mentioned herein. Santander may trade as principal, make a market or hold positions in instruments (or related derivatives) and/or hold financial interest in entities discussed herein. Santander may provide market commentary or trading strategies to other clients or engage in transactions which may differ from views expressed herein. Santander may have acted upon the contents of this publication prior to you having received it.
This publication is intended for the exclusive use of the recipient and must not be reproduced, redistributed or transmitted, in whole or in part, without Santander’s consent. The recipient agrees to keep confidential at all times information contained herein.


