Uncategorized
Putting spreads in context
admin | November 16, 2018
This material is a Marketing Communication and does not constitute Independent Investment Research.
It helps to put the recent widening of credit spreads in context. For investment grade and high yield debt and leveraged loans, spreads and pricing sit close to the median marks of the last five years. If credit quality were constant over that stretch, then the market arguably would be close to fair value. But corporate credit has steadily weakened and fair value in spreads is almost certainly wider than where it sits today. Wider spreads in corporate debt will likely pull structured credit and other market spreads wider and steepen credit spread curves.
Investment grade and high yield debt spreads today sit almost right on top of their median levels for the last five years with prices in leveraged loans right on the median as well (Exhibit 1). Median spreads come in below their averages, of course, since aggressive widening in early 2016 pulls the average up. The same goes for leverage loan pricing, with the median sitting above the average and the average getting dragged down by the sharp price drops of early 2016 (Exhibit 2).
Exhibit 1: Spreads in corporate debt and leverage loans sit right on 5Y medians
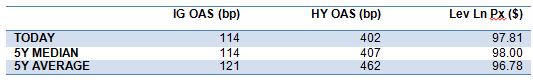
Source: Bloomberg, S&P/LSTA, APS calculations
Exhibit 2: Wide debt spreads and low loan prices in 2016 showed potential risk
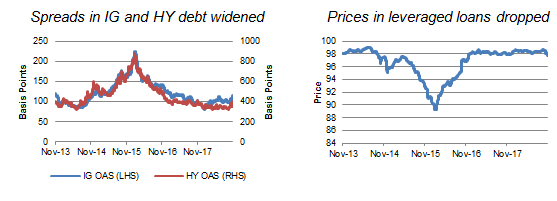
Source: Bloomberg, S&P/LSTA
Medians and averages make good benchmarks when all the other important things stand still – supply, demand and, perhaps most importantly, risk. Risk has definitely not stood still. The rise in investment grade leverage at this point is well told. The increase in covenant-lite leveraged loans is also well told. Corporate balance sheets in general are riskier, but risk needs something to trigger it. And that bring up the issue of the economy.
Spreads and prices on corporate debt over the last five years also reflect market expectations of the economy, and the economy in general has been good. The current expansion is one of the longest in the US since the end of World War II, even though growth has come in well below historic averages. The current issue with economic growth is how far below recent levels it might go. GDP growth in the second quarter of 4.2% is probably the high mark for the foreseeable future. The debate is whether growth will slow to a modestly high levels, to the pace just under 2.0% that the Fed expects or slip into recession.
The higher leverage in investment grade credit and the looser covenants in leveraged loans leave less room for corporate management to maneuver if the economy slows. Many management teams now plan to pay down debt with earnings, but a slower economy could get in the way of those plans. Corporations could stop share buybacks or cut dividends and use the cash to pay down debt. But that will require management to put the debtholder ahead of the shareholder, not the typical ordering. That’s the risk in the market. Not corporate credit alone. Not the economy alone. But both together.
With the intrinsic risk of corporate balance sheets higher than it has been and the path of the economy less certain than it has been, corporate debt should price wider in spread and lower in dollar price than the median levels of the last five years. That’s not a catastrophe. That’s rationale. And there’s no reason for now to expect spreads to run without reason to the levels of early 2016. For that, the market will need to see good reason to expect recession. We’re far from there for now.
* * *
The view in rates
The strategy of buying the 10-year as yields rise beyond 3.15% and selling as yields drop below 2.85% still looks sound. With 10-year yield closing lately near 3.06%, duration looks like fair value. Go neutral on the long end of the curve. The curve still looks set to flatten, however. Look for the Fed to hike through most of 2019. Despite higher rates in the front end, the back end will still tend to price to 2% inflation and somewhere between 1% and 1.3% real rates. That pegs fair value for 10-year notes somewhere between 3.0% and 3.30%.
The view in spreads
The corporate market has become the primary driver of spreads, and the trend looks wider with a steeper spread curve. Continued addition of leverage makes investment grade corporate debt riskier, and potential softening in GDP growth in the second half of this year only raises concerns. A drift wider in corporate spreads would should pull agency MBS and other products along with it, although agency MBS would still likely benefit from investor interest in liquidity.
The view in credit
While the fundamentals of corporate balance sheets have some weak spots, they are harder to find on consumer balance sheets. Median household income is at a record along with household net worth, and household debt costs as a percent of disposable income are near a record low. If there is weakness, it’s in households with sizable student debt, and rising delinquencies in that asset signal that the debt is weighing heavily.
This material is intended only for institutional investors and does not carry all of the independence and disclosure standards of retail debt research reports. In the preparation of this material, the author may have consulted or otherwise discussed the matters referenced herein with one or more of SCM’s trading desks, any of which may have accumulated or otherwise taken a position, long or short, in any of the financial instruments discussed in or related to this material. Further, SCM may act as a market maker or principal dealer and may have proprietary interests that differ or conflict with the recipient hereof, in connection with any financial instrument discussed in or related to this material.
This message, including any attachments or links contained herein, is subject to important disclaimers, conditions, and disclosures regarding Electronic Communications, which you can find at https://portfolio-strategy.apsec.com/sancap-disclaimers-and-disclosures.
Important Disclaimers
Copyright © 2026 Santander US Capital Markets LLC and its affiliates (“SCM”). All rights reserved. SCM is a member of FINRA and SIPC. This material is intended for limited distribution to institutions only and is not publicly available. Any unauthorized use or disclosure is prohibited.
In making this material available, SCM (i) is not providing any advice to the recipient, including, without limitation, any advice as to investment, legal, accounting, tax and financial matters, (ii) is not acting as an advisor or fiduciary in respect of the recipient, (iii) is not making any predictions or projections and (iv) intends that any recipient to which SCM has provided this material is an “institutional investor” (as defined under applicable law and regulation, including FINRA Rule 4512 and that this material will not be disseminated, in whole or part, to any third party by the recipient.
The author of this material is an economist, desk strategist or trader. In the preparation of this material, the author may have consulted or otherwise discussed the matters referenced herein with one or more of SCM’s trading desks, any of which may have accumulated or otherwise taken a position, long or short, in any of the financial instruments discussed in or related to this material. Further, SCM or any of its affiliates may act as a market maker or principal dealer and may have proprietary interests that differ or conflict with the recipient hereof, in connection with any financial instrument discussed in or related to this material.
This material (i) has been prepared for information purposes only and does not constitute a solicitation or an offer to buy or sell any securities, related investments or other financial instruments, (ii) is neither research, a “research report” as commonly understood under the securities laws and regulations promulgated thereunder nor the product of a research department, (iii) or parts thereof may have been obtained from various sources, the reliability of which has not been verified and cannot be guaranteed by SCM, (iv) should not be reproduced or disclosed to any other person, without SCM’s prior consent and (v) is not intended for distribution in any jurisdiction in which its distribution would be prohibited.
In connection with this material, SCM (i) makes no representation or warranties as to the appropriateness or reliance for use in any transaction or as to the permissibility or legality of any financial instrument in any jurisdiction, (ii) believes the information in this material to be reliable, has not independently verified such information and makes no representation, express or implied, with regard to the accuracy or completeness of such information, (iii) accepts no responsibility or liability as to any reliance placed, or investment decision made, on the basis of such information by the recipient and (iv) does not undertake, and disclaims any duty to undertake, to update or to revise the information contained in this material.
Unless otherwise stated, the views, opinions, forecasts, valuations, or estimates contained in this material are those solely of the author, as of the date of publication of this material, and are subject to change without notice. The recipient of this material should make an independent evaluation of this information and make such other investigations as the recipient considers necessary (including obtaining independent financial advice), before transacting in any financial market or instrument discussed in or related to this material.
Important disclaimers for clients in the EU and UK
This publication has been prepared by Trading Desk Strategists within the Sales and Trading functions of Santander US Capital Markets LLC (“SanCap”), the US registered broker-dealer of Santander Corporate & Investment Banking. This communication is distributed in the EEA by Banco Santander S.A., a credit institution registered in Spain and authorised and regulated by the Bank of Spain and the CNMV. Any EEA recipient of this communication that would like to affect any transaction in any security or issuer discussed herein should do so with Banco Santander S.A. or any of its affiliates (together “Santander”). This communication has been distributed in the UK by Banco Santander, S.A.’s London branch, authorised by the Bank of Spain and subject to regulatory oversight on certain matters by the Financial Conduct Authority (FCA) and the Prudential Regulation Authority (PRA).
The publication is intended for exclusive use for Professional Clients and Eligible Counterparties as defined by MiFID II and is not intended for use by retail customers or for any persons or entities in any jurisdictions or country where such distribution or use would be contrary to local law or regulation.
This material is not a product of Santander´s Research Team and does not constitute independent investment research. This is a marketing communication and may contain ¨investment recommendations¨ as defined by the Market Abuse Regulation 596/2014 ("MAR"). This publication has not been prepared in accordance with legal requirements designed to promote the independence of research and is not subject to any prohibition on dealing ahead of the dissemination of investment research. The author, date and time of the production of this publication are as indicated herein.
This publication does not constitute investment advice and may not be relied upon to form an investment decision, nor should it be construed as any offer to sell or issue or invitation to purchase, acquire or subscribe for any instruments referred herein. The publication has been prepared in good faith and based on information Santander considers reliable as of the date of publication, but Santander does not guarantee or represent, express or implied, that such information is accurate or complete. All estimates, forecasts and opinions are current as at the date of this publication and are subject to change without notice. Unless otherwise indicated, Santander does not intend to update this publication. The views and commentary in this publication may not be objective or independent of the interests of the Trading and Sales functions of Santander, who may be active participants in the markets, investments or strategies referred to herein and/or may receive compensation from investment banking and non-investment banking services from entities mentioned herein. Santander may trade as principal, make a market or hold positions in instruments (or related derivatives) and/or hold financial interest in entities discussed herein. Santander may provide market commentary or trading strategies to other clients or engage in transactions which may differ from views expressed herein. Santander may have acted upon the contents of this publication prior to you having received it.
This publication is intended for the exclusive use of the recipient and must not be reproduced, redistributed or transmitted, in whole or in part, without Santander’s consent. The recipient agrees to keep confidential at all times information contained herein.


