Uncategorized
GE legacy called into question
admin | November 9, 2018
This material is a Marketing Communication and does not constitute Independent Investment Research.
GE and its legacy called into question
GE needs no introduction and yet as a corporate bond issuer raises so many questions. This one-time AAA corporate bond issuer now faces high-BBB ratings from all three rating agencies following what could only be categorized as a shockingly-high goodwill impairment charge in 3Q18. The wide range of opinions have resulted in a volatile spread movement in recent weeks, leaving more questions around the company’s future, and as we go to press, the stock is in a near free-fall on negative equity views from the Street.
A slow burn
The slow burn at GE has come in the form of big charges, most recently with the $22 billion charge for a goodwill impairment in the power division. In February 2018 the company had also taken a $9.5 billion pre-tax charge to cover long-term care insurance portfolio obligations. This is a legacy cost from the days when GE still owned Genworth in the GE Capital business. The GE Capital business remains on the hook, and will contribute a total of $15 billion to the reserve fund for legacy long-term care costs for GE. This will take several years to pay and will prevent GE Capital from upstreaming dividends to the GE parent for several years. This certainly contributed to the rationale for the dividend cut to common shares, and reduces the firm’s overall debt-servicing capacity too. When all three ratings firms took GE down 2-notches in October, the specter of GE Capital played a role in the moves.
The most recent quarter showed the market that GE really is struggling to align the diverse and seemingly non-complimentary business lines into a sustainable track for profitability. The two strong performers among the GE businesses in 3Q18 were the aviation and healthcare businesses, with $1.4 billion and $0.9 billion of segment profits respectively. Since the 3Q earnings release GE has announced that it has agreed to sell the lighting division, which contributed only $26 million in 3Q18 profits on $385 million in revenues, and was down 18% year-over-year. Proceeds from the sale were not public, but will modestly improve the cash position for the firm. At the end of 3Q18, GE reported $9.1 billion in cash and adjusted free cash flow of $1.1 billion. Going forward the firm will preserve considerable cash due to the cut in the dividend to shareholders, which is expected to preserve $3.9 billion per year.
With spreads hitting new wide levels in the wake of recent analyst reports, we think the only potentially appealing story could be in the front-end of the curve, particularly as GE faces a very high hurdle getting past 2022. The company has $111.8 billion of total debt, with $44 billion of bonds maturing by 2022. This does not include $5.6 billion of perpetual notes that were the forced-conversion of preferred securities in 2015 that are callable in January 2021. The real liquidity hurdle will come in 2020 when GE has $18.2 billion of debt coming due, and then another $17.5 billion matures over the following two years. Current leverage and servicing figures do not look positive – with debt/EBITDA of 6.62x at 3Q18 and debt/equity of 2.4x, this could create a challenging marketing story amidst the heavy refunding calendar. GE has three bank lines maturing in 2020-2022, which in a worst-case scenario could offer a back-stop if the company faces a liquidity issue.
Exhibit 1: GE credit curve
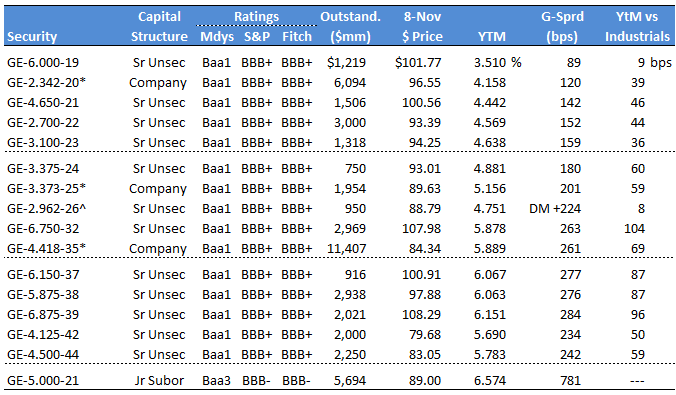
* N.B. denotes GE capital funding, which has parent guarantee. ^ floating rate note; 3mL + 38 bp. Source: Bloomberg and Amherst Pierpont Securities.
Likes and dislikes on the curve
Beyond 2022 the future holds greater funding risks and it seems reasonable to expect that GE will be a very different looking company in 2022 than it is now. That said, we like the ’22 and shorter notes such as the GE 2.70% ’22 senior notes that have a 4.5% yield to maturity and are 40 bp wide of the BBB Industrial index. Conversely, we would avoid or reduce exposure to longer dated notes, as well as the GE 5.00% NC21 perpetual preferred notes, which are callable in January 2021. These notes have traded down to $85-handle and bear a strong chance of being extended by GE, given the call comes in the midst of a big maturity calendar. This is a large issue, as it was originally 3 preferred issuances before the GECC sell-off (Synchrony, etc) back in 2015. The notes currently price with some expectation of extension risk, but could face more selling pressure as the market considers the risk of a dividend suspension or even conversion into common equity (ala Citigroup style). Nevertheless, the 3mL+333 bp reset level provides good protection for bondholders that can hold perpetual notes. Right now that would put the floating rate close to 6%, though that will potentially be subject to a transition to SOFR plus a spread and credit adjustment, as the market is scheduled to transition away from LIBOR by the end of 2022.
This material is intended only for institutional investors and does not carry all of the independence and disclosure standards of retail debt research reports. In the preparation of this material, the author may have consulted or otherwise discussed the matters referenced herein with one or more of SCM’s trading desks, any of which may have accumulated or otherwise taken a position, long or short, in any of the financial instruments discussed in or related to this material. Further, SCM may act as a market maker or principal dealer and may have proprietary interests that differ or conflict with the recipient hereof, in connection with any financial instrument discussed in or related to this material.
This message, including any attachments or links contained herein, is subject to important disclaimers, conditions, and disclosures regarding Electronic Communications, which you can find at https://portfolio-strategy.apsec.com/sancap-disclaimers-and-disclosures.
Important Disclaimers
Copyright © 2026 Santander US Capital Markets LLC and its affiliates (“SCM”). All rights reserved. SCM is a member of FINRA and SIPC. This material is intended for limited distribution to institutions only and is not publicly available. Any unauthorized use or disclosure is prohibited.
In making this material available, SCM (i) is not providing any advice to the recipient, including, without limitation, any advice as to investment, legal, accounting, tax and financial matters, (ii) is not acting as an advisor or fiduciary in respect of the recipient, (iii) is not making any predictions or projections and (iv) intends that any recipient to which SCM has provided this material is an “institutional investor” (as defined under applicable law and regulation, including FINRA Rule 4512 and that this material will not be disseminated, in whole or part, to any third party by the recipient.
The author of this material is an economist, desk strategist or trader. In the preparation of this material, the author may have consulted or otherwise discussed the matters referenced herein with one or more of SCM’s trading desks, any of which may have accumulated or otherwise taken a position, long or short, in any of the financial instruments discussed in or related to this material. Further, SCM or any of its affiliates may act as a market maker or principal dealer and may have proprietary interests that differ or conflict with the recipient hereof, in connection with any financial instrument discussed in or related to this material.
This material (i) has been prepared for information purposes only and does not constitute a solicitation or an offer to buy or sell any securities, related investments or other financial instruments, (ii) is neither research, a “research report” as commonly understood under the securities laws and regulations promulgated thereunder nor the product of a research department, (iii) or parts thereof may have been obtained from various sources, the reliability of which has not been verified and cannot be guaranteed by SCM, (iv) should not be reproduced or disclosed to any other person, without SCM’s prior consent and (v) is not intended for distribution in any jurisdiction in which its distribution would be prohibited.
In connection with this material, SCM (i) makes no representation or warranties as to the appropriateness or reliance for use in any transaction or as to the permissibility or legality of any financial instrument in any jurisdiction, (ii) believes the information in this material to be reliable, has not independently verified such information and makes no representation, express or implied, with regard to the accuracy or completeness of such information, (iii) accepts no responsibility or liability as to any reliance placed, or investment decision made, on the basis of such information by the recipient and (iv) does not undertake, and disclaims any duty to undertake, to update or to revise the information contained in this material.
Unless otherwise stated, the views, opinions, forecasts, valuations, or estimates contained in this material are those solely of the author, as of the date of publication of this material, and are subject to change without notice. The recipient of this material should make an independent evaluation of this information and make such other investigations as the recipient considers necessary (including obtaining independent financial advice), before transacting in any financial market or instrument discussed in or related to this material.
Important disclaimers for clients in the EU and UK
This publication has been prepared by Trading Desk Strategists within the Sales and Trading functions of Santander US Capital Markets LLC (“SanCap”), the US registered broker-dealer of Santander Corporate & Investment Banking. This communication is distributed in the EEA by Banco Santander S.A., a credit institution registered in Spain and authorised and regulated by the Bank of Spain and the CNMV. Any EEA recipient of this communication that would like to affect any transaction in any security or issuer discussed herein should do so with Banco Santander S.A. or any of its affiliates (together “Santander”). This communication has been distributed in the UK by Banco Santander, S.A.’s London branch, authorised by the Bank of Spain and subject to regulatory oversight on certain matters by the Financial Conduct Authority (FCA) and the Prudential Regulation Authority (PRA).
The publication is intended for exclusive use for Professional Clients and Eligible Counterparties as defined by MiFID II and is not intended for use by retail customers or for any persons or entities in any jurisdictions or country where such distribution or use would be contrary to local law or regulation.
This material is not a product of Santander´s Research Team and does not constitute independent investment research. This is a marketing communication and may contain ¨investment recommendations¨ as defined by the Market Abuse Regulation 596/2014 ("MAR"). This publication has not been prepared in accordance with legal requirements designed to promote the independence of research and is not subject to any prohibition on dealing ahead of the dissemination of investment research. The author, date and time of the production of this publication are as indicated herein.
This publication does not constitute investment advice and may not be relied upon to form an investment decision, nor should it be construed as any offer to sell or issue or invitation to purchase, acquire or subscribe for any instruments referred herein. The publication has been prepared in good faith and based on information Santander considers reliable as of the date of publication, but Santander does not guarantee or represent, express or implied, that such information is accurate or complete. All estimates, forecasts and opinions are current as at the date of this publication and are subject to change without notice. Unless otherwise indicated, Santander does not intend to update this publication. The views and commentary in this publication may not be objective or independent of the interests of the Trading and Sales functions of Santander, who may be active participants in the markets, investments or strategies referred to herein and/or may receive compensation from investment banking and non-investment banking services from entities mentioned herein. Santander may trade as principal, make a market or hold positions in instruments (or related derivatives) and/or hold financial interest in entities discussed herein. Santander may provide market commentary or trading strategies to other clients or engage in transactions which may differ from views expressed herein. Santander may have acted upon the contents of this publication prior to you having received it.
This publication is intended for the exclusive use of the recipient and must not be reproduced, redistributed or transmitted, in whole or in part, without Santander’s consent. The recipient agrees to keep confidential at all times information contained herein.


