Uncategorized
Balancing MBS and corporate debt
admin | November 9, 2018
This material is a Marketing Communication and does not constitute Independent Investment Research.
The MBS and corporate debt markets have both widened to the Treasury curve this year for different reasons with spreads between the two sectors lately sitting at the narrow end of the range. Both sectors look likely to widen through 2019, with MBS set to turn in the better performance.
Exhibit 1: MBS and corporate debt spreads stand at their widest levels of 2018
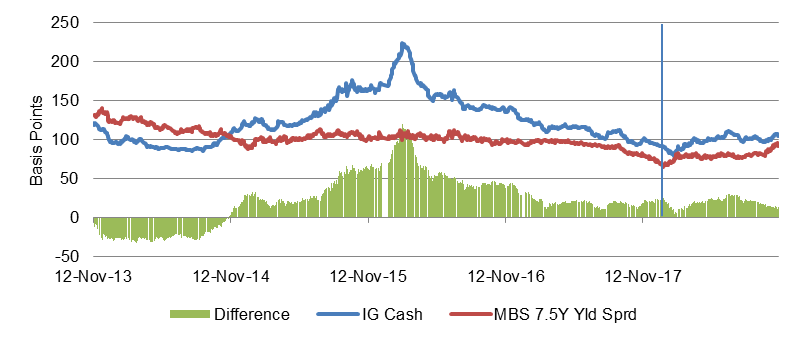
Source: Bloomberg
Both MBS and corporate debt have had the Fed working against them this year. Steadily higher fed funds have had some marginal effect on carry, but steadily lower market liquidity is likely more important. Higher rates and the reversal in QE both have taken cash out of the system. Excess reserves at US banks since October 2017 have dropped by $382 billion. Any drawdown in cash should drive up the value of other liquid, safe assets including Treasury debt. All else equal, all spreads to the Treasury curve should widen with the magnitude depending on relative sector liquidity. The corporate market felt the sharp effect of falling liquidity early this year as repatriation of corporate cash took investors out of the front end of the corporate curve. The Fed has been following up steadily.
The corporate debt market has also seen a steady rise in balance sheet leverage for several years and increasing concentration in ‘BBB’ debt. Today’s ‘BBB’ debt may or may not be weaker than past versions, but ‘BBB’ debt almost indisputably makes the corporate market more vulnerable to any economic slowdown. The Fed’s path has raised reasonable concerns about the pace of growth over the next few years, and the current nearly $3 trillion in ‘BBB’ could disrupt spreads across fixed income if concerns about growth became concerns about recession. Not only do spreads widen sharply as an issuer potentially slides below ‘BBB’, but the issuer loses access to the prime commercial paper markets, making balance sheet liquidity management harder. A rising probability of challenges for ‘BBB’ debt should steepen spreads between safer and riskier debt, a trend that has started this year. If economic growth moderates next year as many economists expect, concern about corporate credit is only likely to grow. Corporate risk is likely to drive the market next year.
MBS actually benefitted early this year from its liquidity relative to corporate debt and other sectors. Correlations between MBS and corporate spreads and anecdotal evidence pointed to a reallocation into MBS. MBS spreads went sideways from February through June and the spread between corporates and MBS widened. MBS spreads have underperformed corporates’ since then.
Lately a familiar set of arguments have come out to explain weaker MBS spreads: the Fed’s steady withdrawal from QE, the slow erosion of TBA quality without the Fed filtering out the worst pools, steady net supply from originations, no clear signal of the next marginal buyer. Those concerns have shaped market expectations since at least early 2017 as the Fed laid out its QE exit strategy, but only since September have spreads seemed to steadily widen. That calls into question the case for these influences, or at least their magnitude. Maybe something about the market since September has finally triggered them—the wolf arriving long after the cry went out—but the thing isn’t obvious.
Exhibit 2: Net YTD supply in agency fixed-rate MBS
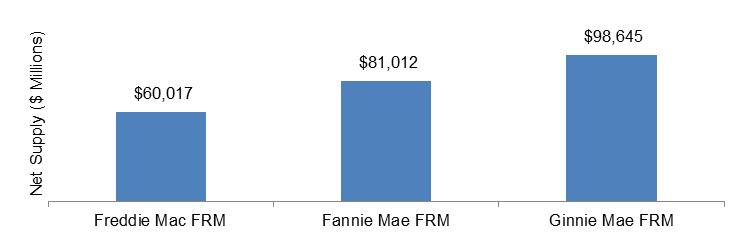
Source: eMBS
The simplest theory of spreads seems to be one centered on the rising fundamental risk in corporate debt. If growth moderates, the market should price a rising probability of problems with ‘BBB.’ That’s an issue big enough to drive market spreads wider and the credit spread curve steeper. If the problem becomes big enough, wider corporate spreads would also tighten financial conditions and possibly change the Fed’s path, too.
The relative advantage that MBS does have is liquidity and safety. The nominal average spread on investment grade corporate debt now stands at 106 bp, the nominal spread of par 30-year MBS to the 7.5-year Treasury stands at 96 bp. That 10 bp spread is at the 22nd percentile of the range over the last five years. Wait for corporate spreads to widen faster than MBS from here.
* * *
The view in rates
The strategy of buying the 10-year as yields rise beyond 3.15% and selling as yields drop below 2.85% still looks sound. With 10-year yield closing lately near 3.18%, duration looks like a modest buy. The curve still looks set to flatten. Look for the Fed to hike through most of 2019. Despite higher rates in the front end, the back end will still tend to price to 2% inflation and somewhere between 1% and 1.3% real rates.
The view in spreads
The corporate market has become the primary driver of spreads, and the trend looks wider with a steeper spread curve. Continued addition of leverage makes investment grade corporate debt riskier, and potential softening in GDP growth in the second half of this year only raises concerns. A drift wider in corporate spreads would should pull agency MBS and other products along with it, although agency MBS would still likely benefit from investor interest in liquidity.
The view in credit
While the fundamentals of corporate balance sheets have some weak spots, they are harder to find on consumer balance sheets. Median household income is at a record along with household net worth, and household debt costs as a percent of disposable income are near a record low. If there is weakness, it’s in households with sizable student debt, and rising delinquencies in that asset signal that the debt is weighing heavily.
This material is intended only for institutional investors and does not carry all of the independence and disclosure standards of retail debt research reports. In the preparation of this material, the author may have consulted or otherwise discussed the matters referenced herein with one or more of SCM’s trading desks, any of which may have accumulated or otherwise taken a position, long or short, in any of the financial instruments discussed in or related to this material. Further, SCM may act as a market maker or principal dealer and may have proprietary interests that differ or conflict with the recipient hereof, in connection with any financial instrument discussed in or related to this material.
This message, including any attachments or links contained herein, is subject to important disclaimers, conditions, and disclosures regarding Electronic Communications, which you can find at https://portfolio-strategy.apsec.com/sancap-disclaimers-and-disclosures.
Important Disclaimers
Copyright © 2026 Santander US Capital Markets LLC and its affiliates (“SCM”). All rights reserved. SCM is a member of FINRA and SIPC. This material is intended for limited distribution to institutions only and is not publicly available. Any unauthorized use or disclosure is prohibited.
In making this material available, SCM (i) is not providing any advice to the recipient, including, without limitation, any advice as to investment, legal, accounting, tax and financial matters, (ii) is not acting as an advisor or fiduciary in respect of the recipient, (iii) is not making any predictions or projections and (iv) intends that any recipient to which SCM has provided this material is an “institutional investor” (as defined under applicable law and regulation, including FINRA Rule 4512 and that this material will not be disseminated, in whole or part, to any third party by the recipient.
The author of this material is an economist, desk strategist or trader. In the preparation of this material, the author may have consulted or otherwise discussed the matters referenced herein with one or more of SCM’s trading desks, any of which may have accumulated or otherwise taken a position, long or short, in any of the financial instruments discussed in or related to this material. Further, SCM or any of its affiliates may act as a market maker or principal dealer and may have proprietary interests that differ or conflict with the recipient hereof, in connection with any financial instrument discussed in or related to this material.
This material (i) has been prepared for information purposes only and does not constitute a solicitation or an offer to buy or sell any securities, related investments or other financial instruments, (ii) is neither research, a “research report” as commonly understood under the securities laws and regulations promulgated thereunder nor the product of a research department, (iii) or parts thereof may have been obtained from various sources, the reliability of which has not been verified and cannot be guaranteed by SCM, (iv) should not be reproduced or disclosed to any other person, without SCM’s prior consent and (v) is not intended for distribution in any jurisdiction in which its distribution would be prohibited.
In connection with this material, SCM (i) makes no representation or warranties as to the appropriateness or reliance for use in any transaction or as to the permissibility or legality of any financial instrument in any jurisdiction, (ii) believes the information in this material to be reliable, has not independently verified such information and makes no representation, express or implied, with regard to the accuracy or completeness of such information, (iii) accepts no responsibility or liability as to any reliance placed, or investment decision made, on the basis of such information by the recipient and (iv) does not undertake, and disclaims any duty to undertake, to update or to revise the information contained in this material.
Unless otherwise stated, the views, opinions, forecasts, valuations, or estimates contained in this material are those solely of the author, as of the date of publication of this material, and are subject to change without notice. The recipient of this material should make an independent evaluation of this information and make such other investigations as the recipient considers necessary (including obtaining independent financial advice), before transacting in any financial market or instrument discussed in or related to this material.
Important disclaimers for clients in the EU and UK
This publication has been prepared by Trading Desk Strategists within the Sales and Trading functions of Santander US Capital Markets LLC (“SanCap”), the US registered broker-dealer of Santander Corporate & Investment Banking. This communication is distributed in the EEA by Banco Santander S.A., a credit institution registered in Spain and authorised and regulated by the Bank of Spain and the CNMV. Any EEA recipient of this communication that would like to affect any transaction in any security or issuer discussed herein should do so with Banco Santander S.A. or any of its affiliates (together “Santander”). This communication has been distributed in the UK by Banco Santander, S.A.’s London branch, authorised by the Bank of Spain and subject to regulatory oversight on certain matters by the Financial Conduct Authority (FCA) and the Prudential Regulation Authority (PRA).
The publication is intended for exclusive use for Professional Clients and Eligible Counterparties as defined by MiFID II and is not intended for use by retail customers or for any persons or entities in any jurisdictions or country where such distribution or use would be contrary to local law or regulation.
This material is not a product of Santander´s Research Team and does not constitute independent investment research. This is a marketing communication and may contain ¨investment recommendations¨ as defined by the Market Abuse Regulation 596/2014 ("MAR"). This publication has not been prepared in accordance with legal requirements designed to promote the independence of research and is not subject to any prohibition on dealing ahead of the dissemination of investment research. The author, date and time of the production of this publication are as indicated herein.
This publication does not constitute investment advice and may not be relied upon to form an investment decision, nor should it be construed as any offer to sell or issue or invitation to purchase, acquire or subscribe for any instruments referred herein. The publication has been prepared in good faith and based on information Santander considers reliable as of the date of publication, but Santander does not guarantee or represent, express or implied, that such information is accurate or complete. All estimates, forecasts and opinions are current as at the date of this publication and are subject to change without notice. Unless otherwise indicated, Santander does not intend to update this publication. The views and commentary in this publication may not be objective or independent of the interests of the Trading and Sales functions of Santander, who may be active participants in the markets, investments or strategies referred to herein and/or may receive compensation from investment banking and non-investment banking services from entities mentioned herein. Santander may trade as principal, make a market or hold positions in instruments (or related derivatives) and/or hold financial interest in entities discussed herein. Santander may provide market commentary or trading strategies to other clients or engage in transactions which may differ from views expressed herein. Santander may have acted upon the contents of this publication prior to you having received it.
This publication is intended for the exclusive use of the recipient and must not be reproduced, redistributed or transmitted, in whole or in part, without Santander’s consent. The recipient agrees to keep confidential at all times information contained herein.


