Uncategorized
A peek at the growth peak hypothesis
admin | November 2, 2018
This material is a Marketing Communication and does not constitute Independent Investment Research.
The drop in US real GDP growth from 4.2% in the second quarter to 3.5% in the third has left some investors concerned the economy has passed its peak and could decay into weakness and ultimately contraction. The corollary then becomes that the Fed should not be raising rates. But this concern ignores the structure of past recoveries. If the Fed can successfully execute a soft landing, as it did in 1994, there is no reason the economy cannot continue to move ahead for several more years. The current expansion is far from being a has-been.
Peak Growth?
The swoon in equity prices in October and the cooling of real GDP growth to a 3.5% annualized pace in the third quarter from a stellar 4.2% Q2 reading have generated considerable speculation that the economy and corporate earnings have already peaked and that it may be “all downhill from here”. In a sense, the “peak growth” story could well be correct. The economy was probably never going to be able to sustain 4.2% growth, which was boosted substantially by a recovery from a tough winter and a depressed Q1 GDP reading. However, 3.5% real growth is nothing to sneeze at, especially in this expansion, when real growth has averaged about 2¼%, a historically anemic performance. Even a further cooling in the current quarter to, say, 3% would still leave the economy in a far better place than it has been for most of the decade, and light years ahead of the Federal Reserve’s estimate for the longer-run growth potential of 1.8%.
More importantly, the presumed implications of peak growth are flawed. In reality, a textbook economic cycle will register its fastest growth during the early stages of a recovery and growth can be expected to slow as the expansion matures. Thus, if the “peak growth” narrative were true, then most expansions would essentially be over not long after they started.
1980s
The classic example of this pattern would be the 1980s expansion, the last time that the U.S. economy suffered through a recession remotely similar to the one that accompanied the Financial Crisis in 2008-2009. In the 1980s, economic growth exploded after the recession ended in late 1982. A four-quarter average of real GDP growth peaked in the first quarter of 1984 at a stunning 8.6%, an era labeled “Morning in America” by Ronald Reagan’s re-election campaign. While growth had not surprisingly already started to ease back somewhat by the end of that election season, the expansion continued all the way until 1990, at the time the second-longest business cycle in modern history.
Exhibit 1: Four-quarter average of real GDP growth – 1980s
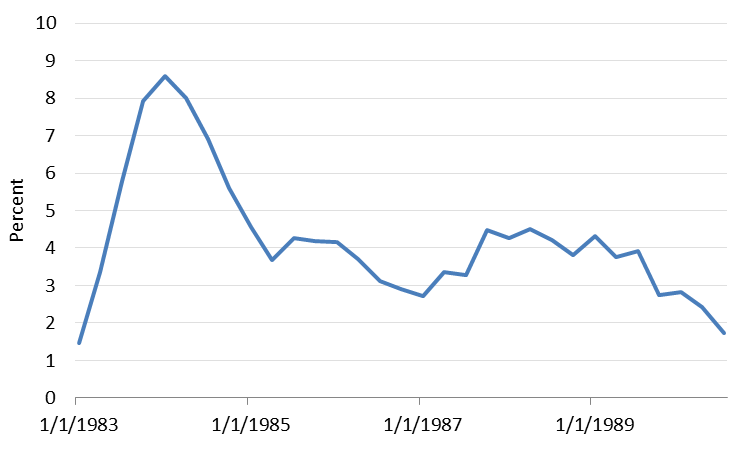
Source: BEA
There are some interesting analogies between the 1980s and the current decade. A major tax reform bill in 1986 helped to give the expansion a second wind at a time when growth had been decelerating for two years straight in 1985 and 1986. New Federal Reserve Chairman Alan Greenspan responded to a severe stock market crash in late 1987 by easing Fed policy. The combination of monetary ease and fiscal boost helped to push real GDP growth back over 4% for much of 1987 and 1988. Unfortunately, the Fed was slow to reverse its easing as growth gathered momentum, ultimately producing an overheated economy. Core inflation surged in 1988 and 1989, forcing the Fed to clamp down hard. The expansion ultimately succumbed to the double whammy of tight monetary policy and oil shocks caused by the first Iraq War in 1990.
1990s
The 1990s expansion was less typical. The recovery phase of the cycle in 1991 – 1992 struggled, but growth took off in 1993 and 1994, setting what looked like it would be the peak for the cycle in 1994. However, the internet revolution and a capital gains tax cut helped to generate an investment boom in the late 1990s that drove a new peak in growth for the cycle in 1998. Ironically, economic growth was surging at exactly the time that market participants were dealing with the Russian debt default and the Long-Term Capital meltdown, leading to another instance where the Fed eased policy ill-advisedly – or, at a minimum, was too slow to reverse themselves — in response to financial volatility. The speculative frenzy, especially in dot.com start-ups, ultimately went too far, leading to a stock price collapse in 2000 and the end of the expansion in early 2001.
Exhibit 2: Four-quarter average of real GDP growth – 1990s

Source: BEA
2000s
The 2000s expansion performed closer to the textbook 1980s pattern, as the four-quarter real growth pace peaked in late 2003, at least partially in response to the tax cuts that were passed in 2001 but only took full effect in 2003. The expansion lasted almost five more years before excesses brought on by easy monetary policy and the housing boom reversed, leading to the worst economic downturn since the 1930s and a financial crisis. Of course, if the Federal Reserve had followed the “peak growth” narrative corollary that it should not raise rates when growth is decelerating, then it would never have hiked at all. The first rate move in the 2000s did not come until June 2004, six months after the four-quarter average of real GDP growth peaked!
Exhibit 3: Four-quarter average of read GDP growth – 2000s
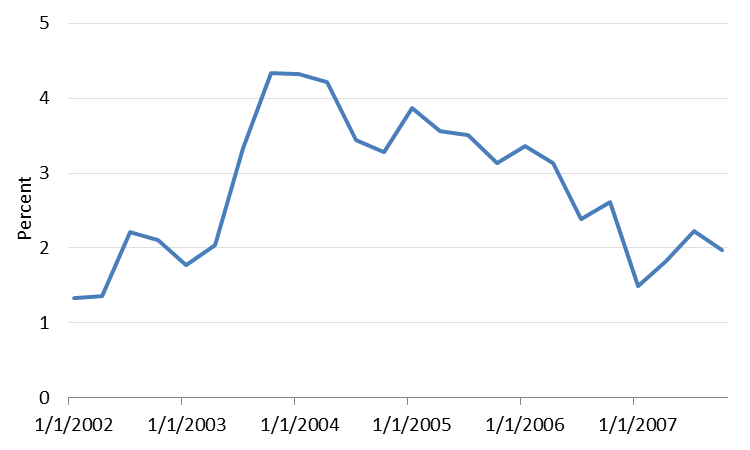
Source: BEA
The Current Expansion
The current cycle has had its own share of irregularities. The recovery was anemic for several years before finally gathering momentum in 2014 and early 2015, though the rigor proved to be short-lived as growth cooled steadily in 2015 and early 2016 before perking up again. Like the 2000s, the Federal Reserve did not even begin to normalize monetary policy until well after growth had already peaked. Like the 1980s, a major tax reform package deep into the business cycle has generated renewed economic momentum. Indeed, the pickup over the past two years in the four-quarter average of real GDP growth has been about 150 bp, similar in magnitude to the acceleration seen in 1987. Growth on a four-quarter basis will probably not reach the 3.8% high-water mark of early 2015, so “peak growth” for this cycle is almost four years in the rearview mirror.
Exhibit 4: Four-quarter average of read GDP growth – 2010s
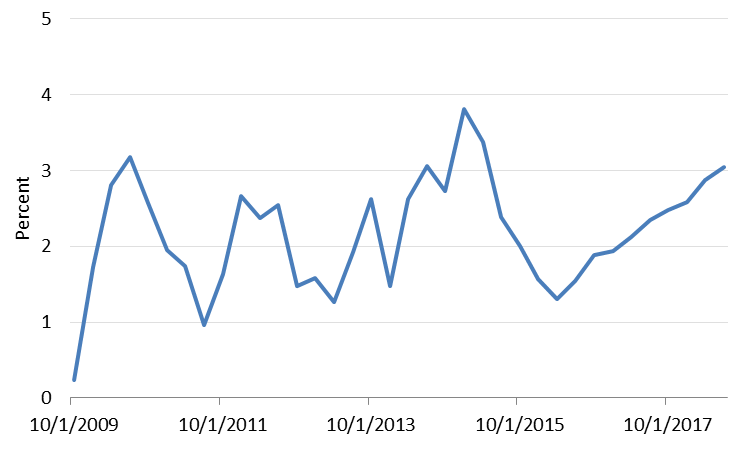
Source: BEA
Conclusion
The common patterns of the past several economic cycles and the peculiarities between them underscore the fact that reaching a peak in the speed of growth is not a death sentence for an expansion. As Fed officials have noted, economic expansions do not die of old age. They typically end when an accumulation of excesses build up to a tipping point, often exacerbated by a discrete event. Even if real GDP growth slows sequentially in the current quarter and again in Q1, the four-quarter average may well continue to accelerate through the first quarter of next year.
The Federal Reserve’s gradual rate hike strategy is an effort to fend off the buildup of the sort of imbalances that have in the past led to recessions. If the Fed can successfully execute a soft landing, as it did in 1994, there is no reason that the economy cannot continue to move ahead for several more years in the absence of a big external shock. Even if the economy has already seen its peak growth, the expansion need not be viewed as a has-been.
This material is intended only for institutional investors and does not carry all of the independence and disclosure standards of retail debt research reports. In the preparation of this material, the author may have consulted or otherwise discussed the matters referenced herein with one or more of SCM’s trading desks, any of which may have accumulated or otherwise taken a position, long or short, in any of the financial instruments discussed in or related to this material. Further, SCM may act as a market maker or principal dealer and may have proprietary interests that differ or conflict with the recipient hereof, in connection with any financial instrument discussed in or related to this material.
This message, including any attachments or links contained herein, is subject to important disclaimers, conditions, and disclosures regarding Electronic Communications, which you can find at https://portfolio-strategy.apsec.com/sancap-disclaimers-and-disclosures.
Important Disclaimers
Copyright © 2026 Santander US Capital Markets LLC and its affiliates (“SCM”). All rights reserved. SCM is a member of FINRA and SIPC. This material is intended for limited distribution to institutions only and is not publicly available. Any unauthorized use or disclosure is prohibited.
In making this material available, SCM (i) is not providing any advice to the recipient, including, without limitation, any advice as to investment, legal, accounting, tax and financial matters, (ii) is not acting as an advisor or fiduciary in respect of the recipient, (iii) is not making any predictions or projections and (iv) intends that any recipient to which SCM has provided this material is an “institutional investor” (as defined under applicable law and regulation, including FINRA Rule 4512 and that this material will not be disseminated, in whole or part, to any third party by the recipient.
The author of this material is an economist, desk strategist or trader. In the preparation of this material, the author may have consulted or otherwise discussed the matters referenced herein with one or more of SCM’s trading desks, any of which may have accumulated or otherwise taken a position, long or short, in any of the financial instruments discussed in or related to this material. Further, SCM or any of its affiliates may act as a market maker or principal dealer and may have proprietary interests that differ or conflict with the recipient hereof, in connection with any financial instrument discussed in or related to this material.
This material (i) has been prepared for information purposes only and does not constitute a solicitation or an offer to buy or sell any securities, related investments or other financial instruments, (ii) is neither research, a “research report” as commonly understood under the securities laws and regulations promulgated thereunder nor the product of a research department, (iii) or parts thereof may have been obtained from various sources, the reliability of which has not been verified and cannot be guaranteed by SCM, (iv) should not be reproduced or disclosed to any other person, without SCM’s prior consent and (v) is not intended for distribution in any jurisdiction in which its distribution would be prohibited.
In connection with this material, SCM (i) makes no representation or warranties as to the appropriateness or reliance for use in any transaction or as to the permissibility or legality of any financial instrument in any jurisdiction, (ii) believes the information in this material to be reliable, has not independently verified such information and makes no representation, express or implied, with regard to the accuracy or completeness of such information, (iii) accepts no responsibility or liability as to any reliance placed, or investment decision made, on the basis of such information by the recipient and (iv) does not undertake, and disclaims any duty to undertake, to update or to revise the information contained in this material.
Unless otherwise stated, the views, opinions, forecasts, valuations, or estimates contained in this material are those solely of the author, as of the date of publication of this material, and are subject to change without notice. The recipient of this material should make an independent evaluation of this information and make such other investigations as the recipient considers necessary (including obtaining independent financial advice), before transacting in any financial market or instrument discussed in or related to this material.
Important disclaimers for clients in the EU and UK
This publication has been prepared by Trading Desk Strategists within the Sales and Trading functions of Santander US Capital Markets LLC (“SanCap”), the US registered broker-dealer of Santander Corporate & Investment Banking. This communication is distributed in the EEA by Banco Santander S.A., a credit institution registered in Spain and authorised and regulated by the Bank of Spain and the CNMV. Any EEA recipient of this communication that would like to affect any transaction in any security or issuer discussed herein should do so with Banco Santander S.A. or any of its affiliates (together “Santander”). This communication has been distributed in the UK by Banco Santander, S.A.’s London branch, authorised by the Bank of Spain and subject to regulatory oversight on certain matters by the Financial Conduct Authority (FCA) and the Prudential Regulation Authority (PRA).
The publication is intended for exclusive use for Professional Clients and Eligible Counterparties as defined by MiFID II and is not intended for use by retail customers or for any persons or entities in any jurisdictions or country where such distribution or use would be contrary to local law or regulation.
This material is not a product of Santander´s Research Team and does not constitute independent investment research. This is a marketing communication and may contain ¨investment recommendations¨ as defined by the Market Abuse Regulation 596/2014 ("MAR"). This publication has not been prepared in accordance with legal requirements designed to promote the independence of research and is not subject to any prohibition on dealing ahead of the dissemination of investment research. The author, date and time of the production of this publication are as indicated herein.
This publication does not constitute investment advice and may not be relied upon to form an investment decision, nor should it be construed as any offer to sell or issue or invitation to purchase, acquire or subscribe for any instruments referred herein. The publication has been prepared in good faith and based on information Santander considers reliable as of the date of publication, but Santander does not guarantee or represent, express or implied, that such information is accurate or complete. All estimates, forecasts and opinions are current as at the date of this publication and are subject to change without notice. Unless otherwise indicated, Santander does not intend to update this publication. The views and commentary in this publication may not be objective or independent of the interests of the Trading and Sales functions of Santander, who may be active participants in the markets, investments or strategies referred to herein and/or may receive compensation from investment banking and non-investment banking services from entities mentioned herein. Santander may trade as principal, make a market or hold positions in instruments (or related derivatives) and/or hold financial interest in entities discussed herein. Santander may provide market commentary or trading strategies to other clients or engage in transactions which may differ from views expressed herein. Santander may have acted upon the contents of this publication prior to you having received it.
This publication is intended for the exclusive use of the recipient and must not be reproduced, redistributed or transmitted, in whole or in part, without Santander’s consent. The recipient agrees to keep confidential at all times information contained herein.


