Uncategorized
A steady steepening of the spread curve
admin | October 26, 2018
This material is a Marketing Communication and does not constitute Independent Investment Research.
A steady rise in the amount of weaker investment grade credit and concern about its ability to weather any softness in the economy may finally be widening spreads to stronger parts of the market. The spread between longer ‘BBB’ and ‘A’ credit started the year around 40 bp but now stands just shy of 65 bp, with just under half the widening coming since the beginning of September. Since ‘BBB’ credit is now more than half of the outstanding investment grade market, the steepening spread curve should echo in other parts of fixed income.
The spread between longer ‘BBB’ and ‘A’ took a 10 bp leg wider in February around the same time that all corporate spreads widened. After meandering wider and then tighter through the summer, the spread has widened another 15 bp as other parts of the market arguably have signaled some economic uncertainty—a relatively flat yield curve in September and equity volatility in October.
Exhibit 1: A widening spread between ‘BBB’ and ‘A’ corporate credit
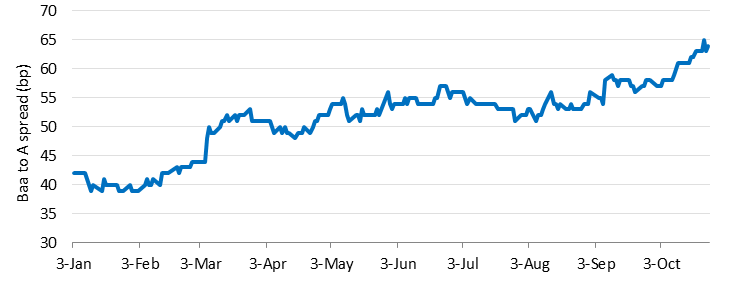
Source: Moody’s ‘BBB’ and ‘A’ spread indices, which are centered around 20- to 30-year maturity debt.
Although the increase in size and leverage in the ‘BBB’ corporate market continues to attract attention (Rising risk from BBBs), the steepening of the spread curve is the most relevant risk for other parts of fixed income. The spread curve between ‘BBB’ and ‘A’ CLOs has also steepened this year by 35 bp. The spread curve across the parts of the CMBS market with the most liquidity and easiest price discovery have steepened over the last month and stand to steepen further. Both CLOs and CMBS embed underlying corporate risk. In consumer assets, however, the steepening is harder to see—but price discovery deeper in the ratings stack arguably is cloudier, too. Very little steepening is apparent in single-family rental, for instance. Very little is obvious yet in broad parts of credit cards or autos. Consumer assets, however, depend on a generally robust household balance sheet where income, net worth and the ability to serve debt continue to look very strong.
Since the economy started growing in June 2009, a spike in equity volatility has slightly widened spreads before. More often than not, volatility has drifted lower, equity has recovered and spreads have regained some of the lost ground. Nevertheless, these episodes are valuable dry-runs for the point where the market finally sees fundamental economic slowing. We’re not there yet. But that may be next year’s story.
* * *
The view in rates
The market continues to find reasons to drive yields broadly lower and slightly flatter, a very reasonable expectation when 10-year yields approached 3.25%. With yields now at 3.08%, the 10-year note looks very close to fair value. Neutral on duration sounds right for now. And the strategy of buying the 10-year as yields rise beyond 3.15% and selling as yields drop below 2.85% still seems like a good approach. Yields on the front end of the curve, however, look bound to keep rising. The last set of FOMC minutes continue to make clear the Fed’s intent to hike through most of 2019. The minutes included a clear discussion of potentially hiking through neutral into restrictive territory. Look for the curve to keep flattening from here.
The view in spreads
The corporate market has become the primary driver of spreads, and the trend looks wider with a steeper spread curve. Continued addition of leverage makes investment grade corporate debt riskier, and potential softening in GDP growth in the second half of this year only raises concerns. A drift wider in corporate spreads would likely pull agency MBS and other products along with it, although agency MBS would still likely benefit from investor interest in liquidity.
The view in credit
While the fundamentals of corporate balance sheets have some weak spots, they are harder to find on consumer balance sheets. Median household income is at a record along with household net worth, and household debt costs as a percent of disposable income are near a record low. If there is weakness, it’s in households with sizable student debt, and rising delinquencies in that asset signal that the debt is weighing heavily.
This material is intended only for institutional investors and does not carry all of the independence and disclosure standards of retail debt research reports. In the preparation of this material, the author may have consulted or otherwise discussed the matters referenced herein with one or more of SCM’s trading desks, any of which may have accumulated or otherwise taken a position, long or short, in any of the financial instruments discussed in or related to this material. Further, SCM may act as a market maker or principal dealer and may have proprietary interests that differ or conflict with the recipient hereof, in connection with any financial instrument discussed in or related to this material.
This message, including any attachments or links contained herein, is subject to important disclaimers, conditions, and disclosures regarding Electronic Communications, which you can find at https://portfolio-strategy.apsec.com/sancap-disclaimers-and-disclosures.
Important Disclaimers
Copyright © 2026 Santander US Capital Markets LLC and its affiliates (“SCM”). All rights reserved. SCM is a member of FINRA and SIPC. This material is intended for limited distribution to institutions only and is not publicly available. Any unauthorized use or disclosure is prohibited.
In making this material available, SCM (i) is not providing any advice to the recipient, including, without limitation, any advice as to investment, legal, accounting, tax and financial matters, (ii) is not acting as an advisor or fiduciary in respect of the recipient, (iii) is not making any predictions or projections and (iv) intends that any recipient to which SCM has provided this material is an “institutional investor” (as defined under applicable law and regulation, including FINRA Rule 4512 and that this material will not be disseminated, in whole or part, to any third party by the recipient.
The author of this material is an economist, desk strategist or trader. In the preparation of this material, the author may have consulted or otherwise discussed the matters referenced herein with one or more of SCM’s trading desks, any of which may have accumulated or otherwise taken a position, long or short, in any of the financial instruments discussed in or related to this material. Further, SCM or any of its affiliates may act as a market maker or principal dealer and may have proprietary interests that differ or conflict with the recipient hereof, in connection with any financial instrument discussed in or related to this material.
This material (i) has been prepared for information purposes only and does not constitute a solicitation or an offer to buy or sell any securities, related investments or other financial instruments, (ii) is neither research, a “research report” as commonly understood under the securities laws and regulations promulgated thereunder nor the product of a research department, (iii) or parts thereof may have been obtained from various sources, the reliability of which has not been verified and cannot be guaranteed by SCM, (iv) should not be reproduced or disclosed to any other person, without SCM’s prior consent and (v) is not intended for distribution in any jurisdiction in which its distribution would be prohibited.
In connection with this material, SCM (i) makes no representation or warranties as to the appropriateness or reliance for use in any transaction or as to the permissibility or legality of any financial instrument in any jurisdiction, (ii) believes the information in this material to be reliable, has not independently verified such information and makes no representation, express or implied, with regard to the accuracy or completeness of such information, (iii) accepts no responsibility or liability as to any reliance placed, or investment decision made, on the basis of such information by the recipient and (iv) does not undertake, and disclaims any duty to undertake, to update or to revise the information contained in this material.
Unless otherwise stated, the views, opinions, forecasts, valuations, or estimates contained in this material are those solely of the author, as of the date of publication of this material, and are subject to change without notice. The recipient of this material should make an independent evaluation of this information and make such other investigations as the recipient considers necessary (including obtaining independent financial advice), before transacting in any financial market or instrument discussed in or related to this material.
Important disclaimers for clients in the EU and UK
This publication has been prepared by Trading Desk Strategists within the Sales and Trading functions of Santander US Capital Markets LLC (“SanCap”), the US registered broker-dealer of Santander Corporate & Investment Banking. This communication is distributed in the EEA by Banco Santander S.A., a credit institution registered in Spain and authorised and regulated by the Bank of Spain and the CNMV. Any EEA recipient of this communication that would like to affect any transaction in any security or issuer discussed herein should do so with Banco Santander S.A. or any of its affiliates (together “Santander”). This communication has been distributed in the UK by Banco Santander, S.A.’s London branch, authorised by the Bank of Spain and subject to regulatory oversight on certain matters by the Financial Conduct Authority (FCA) and the Prudential Regulation Authority (PRA).
The publication is intended for exclusive use for Professional Clients and Eligible Counterparties as defined by MiFID II and is not intended for use by retail customers or for any persons or entities in any jurisdictions or country where such distribution or use would be contrary to local law or regulation.
This material is not a product of Santander´s Research Team and does not constitute independent investment research. This is a marketing communication and may contain ¨investment recommendations¨ as defined by the Market Abuse Regulation 596/2014 ("MAR"). This publication has not been prepared in accordance with legal requirements designed to promote the independence of research and is not subject to any prohibition on dealing ahead of the dissemination of investment research. The author, date and time of the production of this publication are as indicated herein.
This publication does not constitute investment advice and may not be relied upon to form an investment decision, nor should it be construed as any offer to sell or issue or invitation to purchase, acquire or subscribe for any instruments referred herein. The publication has been prepared in good faith and based on information Santander considers reliable as of the date of publication, but Santander does not guarantee or represent, express or implied, that such information is accurate or complete. All estimates, forecasts and opinions are current as at the date of this publication and are subject to change without notice. Unless otherwise indicated, Santander does not intend to update this publication. The views and commentary in this publication may not be objective or independent of the interests of the Trading and Sales functions of Santander, who may be active participants in the markets, investments or strategies referred to herein and/or may receive compensation from investment banking and non-investment banking services from entities mentioned herein. Santander may trade as principal, make a market or hold positions in instruments (or related derivatives) and/or hold financial interest in entities discussed herein. Santander may provide market commentary or trading strategies to other clients or engage in transactions which may differ from views expressed herein. Santander may have acted upon the contents of this publication prior to you having received it.
This publication is intended for the exclusive use of the recipient and must not be reproduced, redistributed or transmitted, in whole or in part, without Santander’s consent. The recipient agrees to keep confidential at all times information contained herein.


