Uncategorized
A cautious outlook on EU banks
admin | October 5, 2018
This material is a Marketing Communication and does not constitute Independent Investment Research.
The post-crisis regulatory cleansing has tightened the correlation of credit spread to ratings category among banks and insurers. Yankee banks continue to exhibit more spread volatility than their US counterparts, in part due to more challenging markets in Europe and, in some cases, ongoing regulatory investigations. We evaluate opportunities to selectively reduce holdings among EU banks.
Correlation between US bank spreads and ratings has tightened
For the last 18+months, domestic bank spreads have been more closely correlated than in the prior decade. This should seem intuitive as the banking system benefits from the “cleansing” process brought about by the financial crisis of 2008-09. As seen in the regression graph below, the domestic bank 5-year senior holding company (HC) bond index follows a very close correlation to the mean spread regression. In select cases there are some reference bonds that are wide of the regression line, but for seemingly logical reasons. For example, the KEY 5.10% ’21 senior HC notes trade tight as they are the only senior HC bond anywhere close to 5-year maturity, and the front-end of the curve tends to trade rich. We think it is the scarcity value of the KEY notes that drives the spreads so much tighter than for peers’ bonds.
Exhibit 1: Domestic bank holdco 5-year comps (g-spread)
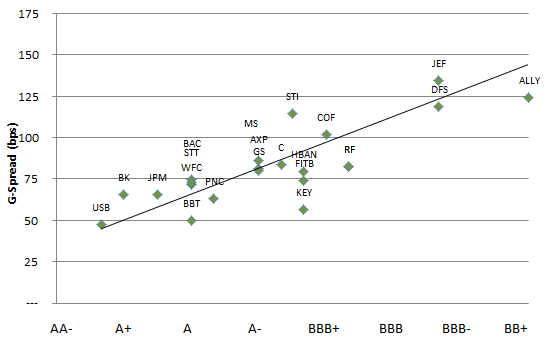
Source: Bloomberg, Amherst Pierpont
This tight correlation is also evident in the insurance space, but to a lesser extent. The REIT issuers tend to trade with the least correlation to the mean among the three primary financial sectors, which could be due in large part to the low trading volume of the bonds and the small issuance sizes. This reinforces the idea that diminished liquidity in a bond or issuer will elevate the risk premium needed by investors. Until the domestic banking or insurance space experiences capital losses or other material challenges, we don’t expect this correlation to break-down.
Yankee banks still facing more volatility than US banks
European banks continue to trade wide of the domestic issuers, and with less correlation to the mean, however with less variation than in recent years. As seen in the second graph, the variance for bank spreads from the mean regression is slightly more than for the US banks (lower r-squared value vs US banks). This will remain true for European banks as long as they continue to face more challenging markets in Italy, the UK, and peripheral markets where they operate. Additionally, banks from a number of countries have faced recurring operational problems, key among them recently have been money laundering violations.
Exhibit 2: EU bank holdco 5-year comps (g-spread)
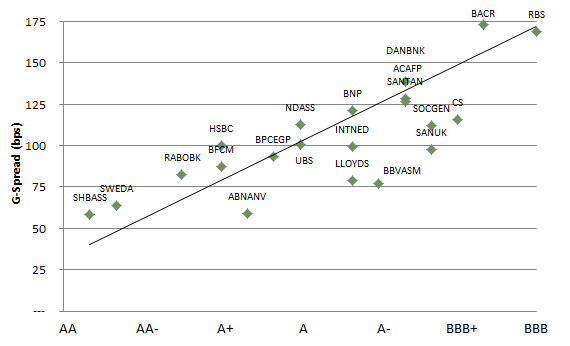
Source: Bloomberg, Amherst Pierpont
The money laundering probe at Danske is escalating, with the incremental risk widening spreads. Danske shares are down 8% in EU markets as warnings for the size of the fine are increasing to €1.8 billion ($2.07 billion) or more. This seems manageable from an earnings standpoint given the last twelve months net income of $3.07 billion. Nevertheless, the bank had cited higher operating costs and impacts from IFRS9 as eating into profits at the 1H18 presentation (marginal profits low with ROA of 56 bp).
Danske could temporarily be shut out of the debt funding markets until primary law enforcement and regulatory agencies finish their investigation, and levy fines and/or penalties. If the process drags on for weeks or months, it could erode a bit of liquidity. This is not an immediate concern given their liquidity coverage ratio was 142% at 1H18. What’s more, while the maturity curve for Danske is very front-end heavy, most of the company’s wholesale funding is in Danish krone, which should ease funding pressures when they come back to the market.
Relative value
In June this year DANBNK 3.875% ’23 senior notes were issued at +120 bp, and most recently traded only slightly wider at +128 bp (8 bp tighter w/w too). We look to reduce exposures at current levels given what could still turn up in the course of the investigations. We remain cautious on the ’23 issuance in June based on the poor relative value to peers, which preceded any hint of legal problems and reinforces our level of caution. For example, the BNP 3.50% ’23 SNP was issued at +90 bp in mid-February and now trades +115 bp, is rated one-notch higher than DANBNK by both S&P and Fitch, and does not face the legal issues of Danske.
While most of the European banks have materially improved capital, liquidity and asset quality levels, which has reduced inherent risk in the system, there remains a problem with valuation. We had been bullish on EU banks for a number of years coming out of the banking crisis of 2012. The approach proved rewarding until 1Q16 when the broader market sold off, but has been a good play for investors again into 2018. However, given the relatively low spreads among EU banks, and the elevated risk in the system, it may be a good time to reduce selective holdings among the names.
This material is intended only for institutional investors and does not carry all of the independence and disclosure standards of retail debt research reports. In the preparation of this material, the author may have consulted or otherwise discussed the matters referenced herein with one or more of SCM’s trading desks, any of which may have accumulated or otherwise taken a position, long or short, in any of the financial instruments discussed in or related to this material. Further, SCM may act as a market maker or principal dealer and may have proprietary interests that differ or conflict with the recipient hereof, in connection with any financial instrument discussed in or related to this material.
This message, including any attachments or links contained herein, is subject to important disclaimers, conditions, and disclosures regarding Electronic Communications, which you can find at https://portfolio-strategy.apsec.com/sancap-disclaimers-and-disclosures.
Important Disclaimers
Copyright © 2026 Santander US Capital Markets LLC and its affiliates (“SCM”). All rights reserved. SCM is a member of FINRA and SIPC. This material is intended for limited distribution to institutions only and is not publicly available. Any unauthorized use or disclosure is prohibited.
In making this material available, SCM (i) is not providing any advice to the recipient, including, without limitation, any advice as to investment, legal, accounting, tax and financial matters, (ii) is not acting as an advisor or fiduciary in respect of the recipient, (iii) is not making any predictions or projections and (iv) intends that any recipient to which SCM has provided this material is an “institutional investor” (as defined under applicable law and regulation, including FINRA Rule 4512 and that this material will not be disseminated, in whole or part, to any third party by the recipient.
The author of this material is an economist, desk strategist or trader. In the preparation of this material, the author may have consulted or otherwise discussed the matters referenced herein with one or more of SCM’s trading desks, any of which may have accumulated or otherwise taken a position, long or short, in any of the financial instruments discussed in or related to this material. Further, SCM or any of its affiliates may act as a market maker or principal dealer and may have proprietary interests that differ or conflict with the recipient hereof, in connection with any financial instrument discussed in or related to this material.
This material (i) has been prepared for information purposes only and does not constitute a solicitation or an offer to buy or sell any securities, related investments or other financial instruments, (ii) is neither research, a “research report” as commonly understood under the securities laws and regulations promulgated thereunder nor the product of a research department, (iii) or parts thereof may have been obtained from various sources, the reliability of which has not been verified and cannot be guaranteed by SCM, (iv) should not be reproduced or disclosed to any other person, without SCM’s prior consent and (v) is not intended for distribution in any jurisdiction in which its distribution would be prohibited.
In connection with this material, SCM (i) makes no representation or warranties as to the appropriateness or reliance for use in any transaction or as to the permissibility or legality of any financial instrument in any jurisdiction, (ii) believes the information in this material to be reliable, has not independently verified such information and makes no representation, express or implied, with regard to the accuracy or completeness of such information, (iii) accepts no responsibility or liability as to any reliance placed, or investment decision made, on the basis of such information by the recipient and (iv) does not undertake, and disclaims any duty to undertake, to update or to revise the information contained in this material.
Unless otherwise stated, the views, opinions, forecasts, valuations, or estimates contained in this material are those solely of the author, as of the date of publication of this material, and are subject to change without notice. The recipient of this material should make an independent evaluation of this information and make such other investigations as the recipient considers necessary (including obtaining independent financial advice), before transacting in any financial market or instrument discussed in or related to this material.
Important disclaimers for clients in the EU and UK
This publication has been prepared by Trading Desk Strategists within the Sales and Trading functions of Santander US Capital Markets LLC (“SanCap”), the US registered broker-dealer of Santander Corporate & Investment Banking. This communication is distributed in the EEA by Banco Santander S.A., a credit institution registered in Spain and authorised and regulated by the Bank of Spain and the CNMV. Any EEA recipient of this communication that would like to affect any transaction in any security or issuer discussed herein should do so with Banco Santander S.A. or any of its affiliates (together “Santander”). This communication has been distributed in the UK by Banco Santander, S.A.’s London branch, authorised by the Bank of Spain and subject to regulatory oversight on certain matters by the Financial Conduct Authority (FCA) and the Prudential Regulation Authority (PRA).
The publication is intended for exclusive use for Professional Clients and Eligible Counterparties as defined by MiFID II and is not intended for use by retail customers or for any persons or entities in any jurisdictions or country where such distribution or use would be contrary to local law or regulation.
This material is not a product of Santander´s Research Team and does not constitute independent investment research. This is a marketing communication and may contain ¨investment recommendations¨ as defined by the Market Abuse Regulation 596/2014 ("MAR"). This publication has not been prepared in accordance with legal requirements designed to promote the independence of research and is not subject to any prohibition on dealing ahead of the dissemination of investment research. The author, date and time of the production of this publication are as indicated herein.
This publication does not constitute investment advice and may not be relied upon to form an investment decision, nor should it be construed as any offer to sell or issue or invitation to purchase, acquire or subscribe for any instruments referred herein. The publication has been prepared in good faith and based on information Santander considers reliable as of the date of publication, but Santander does not guarantee or represent, express or implied, that such information is accurate or complete. All estimates, forecasts and opinions are current as at the date of this publication and are subject to change without notice. Unless otherwise indicated, Santander does not intend to update this publication. The views and commentary in this publication may not be objective or independent of the interests of the Trading and Sales functions of Santander, who may be active participants in the markets, investments or strategies referred to herein and/or may receive compensation from investment banking and non-investment banking services from entities mentioned herein. Santander may trade as principal, make a market or hold positions in instruments (or related derivatives) and/or hold financial interest in entities discussed herein. Santander may provide market commentary or trading strategies to other clients or engage in transactions which may differ from views expressed herein. Santander may have acted upon the contents of this publication prior to you having received it.
This publication is intended for the exclusive use of the recipient and must not be reproduced, redistributed or transmitted, in whole or in part, without Santander’s consent. The recipient agrees to keep confidential at all times information contained herein.


