Uncategorized
Value in Ginnie Mae low loan balance pools
admin | September 28, 2018
This material is a Marketing Communication and does not constitute Independent Investment Research.
Like conventional borrowers, FHA and VA borrowers with smaller loans are less likely to refinance since potential savings are lower. But the only way to create Ginnie Mae specified pools is through the Ginnie Mae II custom program, and those pools are not TBA deliverable. This hurts execution and helps keep payups lower than theoretical levels, increasing the value to investors. Ginnie Mae low loan balance pools look like a good source of call protection for investors.
Low loan balance Ginnie Mae pools offer substantial call protection
Borrowers with smaller loan balances prepay more slowly since less money is saved by refinancing compared to a larger loan. There are also fixed costs in the origination process—home appraisal and credit reports, for example—that disproportionately reduce the savings for smaller loans. Exhibit 1 (below) shows that the S-Curves for 2016 and 2017 originated loans are progressively flatter as loan size decreases.
Exhibit 1: Ginnie Mae S-curves flatten as loan size decreases
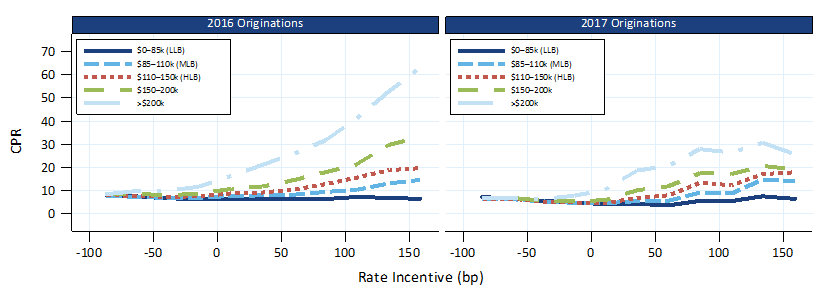
Source: Ginnie Mae, eMBS, 1010data, Amherst Pierpont Securities
Another reason these loans prepay slower is loan officer compensation, which is proportional to the loan amount. However origination and underwriting requires the same amount of time and effort regardless of loan amount. Therefore loan officers have less incentive to solicit these borrowers to refinance. This means low loan balance pools provide prepayment protection for even traditionally fast servicers.
Low balance loans were less sensitive to the FHA’s MIP reduction
FHA prepayments are sensitive to the current level of annual mortgage insurance premiums (“MIP”) charged by the FHA. If the current loan is paying a higher MIP it could make sense to refinance even if the note rate is unchanged. While the current administration has signaled that MIP cuts are unlikely, this policy risk remains a concern for many investors.
Low balance loans proved less sensitive to the January 2015 MIP cut, which lowered the annual MIP to 85 bp. Prepayment speeds for the 2013 and 2014 vintage loans, which predominantly paid 135 bp MIP, are shown in Exhibit 2 (below). The MIP reduction and a drop in mortgage rates triggered a massive spike in prepayments—FHA 4.5%s with loan size greater than $200,000 topped 70 CPR. However, lower loan size buckets prepaid progressively slower, culminating in virtually unchanged speeds in the LLB cohorts.
Exhibit 2: Low loan balance protected against FHA MIP cuts
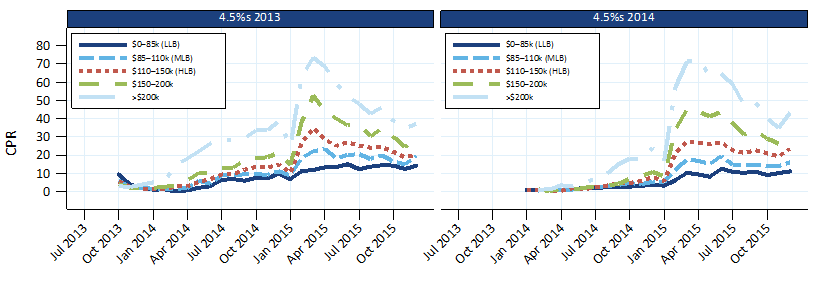
Source: Ginnie Mae, eMBS, 1010data, Amherst Pierpont Securities
Low loan balance protects against fast VA prepayments
Low balance loans have also provided call protection for VA loans, which have prepaid very quickly over the last few years. Exhibit 3 (below) shows S-Curves for 2016 and 2017 vintage VA loans, which have been some of the worst performers. The call protection afforded by loan balance is evident—high balance 2016 VA loans reached 90 CPR at the peak of the S-Curve while LLB loans remained at roughly 10 CPR.
This material is intended only for institutional investors and does not carry all of the independence and disclosure standards of retail debt research reports. In the preparation of this material, the author may have consulted or otherwise discussed the matters referenced herein with one or more of SCM’s trading desks, any of which may have accumulated or otherwise taken a position, long or short, in any of the financial instruments discussed in or related to this material. Further, SCM may act as a market maker or principal dealer and may have proprietary interests that differ or conflict with the recipient hereof, in connection with any financial instrument discussed in or related to this material.
This message, including any attachments or links contained herein, is subject to important disclaimers, conditions, and disclosures regarding Electronic Communications, which you can find at https://portfolio-strategy.apsec.com/sancap-disclaimers-and-disclosures.
Important Disclaimers
Copyright © 2026 Santander US Capital Markets LLC and its affiliates (“SCM”). All rights reserved. SCM is a member of FINRA and SIPC. This material is intended for limited distribution to institutions only and is not publicly available. Any unauthorized use or disclosure is prohibited.
In making this material available, SCM (i) is not providing any advice to the recipient, including, without limitation, any advice as to investment, legal, accounting, tax and financial matters, (ii) is not acting as an advisor or fiduciary in respect of the recipient, (iii) is not making any predictions or projections and (iv) intends that any recipient to which SCM has provided this material is an “institutional investor” (as defined under applicable law and regulation, including FINRA Rule 4512 and that this material will not be disseminated, in whole or part, to any third party by the recipient.
The author of this material is an economist, desk strategist or trader. In the preparation of this material, the author may have consulted or otherwise discussed the matters referenced herein with one or more of SCM’s trading desks, any of which may have accumulated or otherwise taken a position, long or short, in any of the financial instruments discussed in or related to this material. Further, SCM or any of its affiliates may act as a market maker or principal dealer and may have proprietary interests that differ or conflict with the recipient hereof, in connection with any financial instrument discussed in or related to this material.
This material (i) has been prepared for information purposes only and does not constitute a solicitation or an offer to buy or sell any securities, related investments or other financial instruments, (ii) is neither research, a “research report” as commonly understood under the securities laws and regulations promulgated thereunder nor the product of a research department, (iii) or parts thereof may have been obtained from various sources, the reliability of which has not been verified and cannot be guaranteed by SCM, (iv) should not be reproduced or disclosed to any other person, without SCM’s prior consent and (v) is not intended for distribution in any jurisdiction in which its distribution would be prohibited.
In connection with this material, SCM (i) makes no representation or warranties as to the appropriateness or reliance for use in any transaction or as to the permissibility or legality of any financial instrument in any jurisdiction, (ii) believes the information in this material to be reliable, has not independently verified such information and makes no representation, express or implied, with regard to the accuracy or completeness of such information, (iii) accepts no responsibility or liability as to any reliance placed, or investment decision made, on the basis of such information by the recipient and (iv) does not undertake, and disclaims any duty to undertake, to update or to revise the information contained in this material.
Unless otherwise stated, the views, opinions, forecasts, valuations, or estimates contained in this material are those solely of the author, as of the date of publication of this material, and are subject to change without notice. The recipient of this material should make an independent evaluation of this information and make such other investigations as the recipient considers necessary (including obtaining independent financial advice), before transacting in any financial market or instrument discussed in or related to this material.
Important disclaimers for clients in the EU and UK
This publication has been prepared by Trading Desk Strategists within the Sales and Trading functions of Santander US Capital Markets LLC (“SanCap”), the US registered broker-dealer of Santander Corporate & Investment Banking. This communication is distributed in the EEA by Banco Santander S.A., a credit institution registered in Spain and authorised and regulated by the Bank of Spain and the CNMV. Any EEA recipient of this communication that would like to affect any transaction in any security or issuer discussed herein should do so with Banco Santander S.A. or any of its affiliates (together “Santander”). This communication has been distributed in the UK by Banco Santander, S.A.’s London branch, authorised by the Bank of Spain and subject to regulatory oversight on certain matters by the Financial Conduct Authority (FCA) and the Prudential Regulation Authority (PRA).
The publication is intended for exclusive use for Professional Clients and Eligible Counterparties as defined by MiFID II and is not intended for use by retail customers or for any persons or entities in any jurisdictions or country where such distribution or use would be contrary to local law or regulation.
This material is not a product of Santander´s Research Team and does not constitute independent investment research. This is a marketing communication and may contain ¨investment recommendations¨ as defined by the Market Abuse Regulation 596/2014 ("MAR"). This publication has not been prepared in accordance with legal requirements designed to promote the independence of research and is not subject to any prohibition on dealing ahead of the dissemination of investment research. The author, date and time of the production of this publication are as indicated herein.
This publication does not constitute investment advice and may not be relied upon to form an investment decision, nor should it be construed as any offer to sell or issue or invitation to purchase, acquire or subscribe for any instruments referred herein. The publication has been prepared in good faith and based on information Santander considers reliable as of the date of publication, but Santander does not guarantee or represent, express or implied, that such information is accurate or complete. All estimates, forecasts and opinions are current as at the date of this publication and are subject to change without notice. Unless otherwise indicated, Santander does not intend to update this publication. The views and commentary in this publication may not be objective or independent of the interests of the Trading and Sales functions of Santander, who may be active participants in the markets, investments or strategies referred to herein and/or may receive compensation from investment banking and non-investment banking services from entities mentioned herein. Santander may trade as principal, make a market or hold positions in instruments (or related derivatives) and/or hold financial interest in entities discussed herein. Santander may provide market commentary or trading strategies to other clients or engage in transactions which may differ from views expressed herein. Santander may have acted upon the contents of this publication prior to you having received it.
This publication is intended for the exclusive use of the recipient and must not be reproduced, redistributed or transmitted, in whole or in part, without Santander’s consent. The recipient agrees to keep confidential at all times information contained herein.


