Uncategorized
Housing affordability falls but still beats long averages
admin | September 28, 2018
This material is a Marketing Communication and does not constitute Independent Investment Research.
Current levels of home affordability still look strong, especially in a historical context. The gap between current prices and the higher price that households could afford to pay has tightened significantly as we move away from historically low rates, deeply distressed home values and a wide gap between home price and income growth. And the gap looks to stabilize absent a significant rise in interest rates.
Even though home prices continue to rise faster than wages, the median household still can afford to pay 20% more than the price for the median existing home sold. That is down from the 70% premium that the average household could afford in the early years of this decade but still well above levels before the 2008 financial crisis. Households look likely to hold onto that buying power in the next few years.
Exhibit 1: Premium that the median household could pay above the price for the median home sold
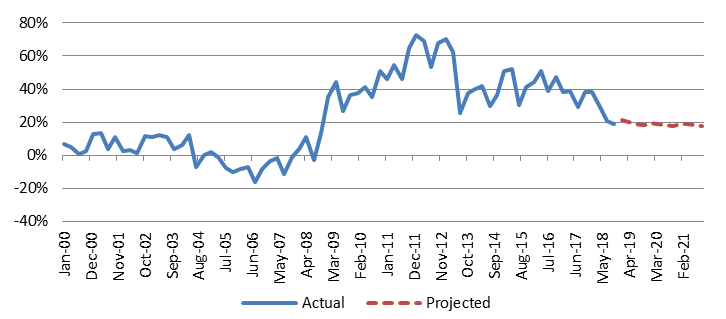
Source: NAR, US Census, Amherst Insight Labs, Amherst Pierpont. Note: Median home price reflects median existing home sale price as reported by the National Association of Realtors.
Affordability has fallen over recent years as US interest rates have come off historic lows and home prices that cratered upwards of 40% in some areas during the depths of the financial crisis. Home prices have outstripped income growth in recent years, further cramping affordability.
But affordability still looks reasonably strong through a longer historic lens. Current levels of household income, existing home sales prices and current mortgage rates suggest that median existing home sale prices are 20% below the level the average household could afford to pay. Our estimate assumes that a household would be willing to spend 25% of their gross income on housing and that they would finance 80% of the value of the home. An increase in DTI would improve affordability while increased leverage would push it lower.
The median household could afford to pay only 7.1% above the median sales price between 2000 and 2003 in somewhat of a normalized credit, albeit declining rate environment, significantly below current levels. Not surprisingly, the price premium was the lowest when credit eased the most during the crisis and the premium expanded massively as rates and home prices fell in the wake of the crisis.
Exhibit 2: Median home sales price versus price the average household could afford
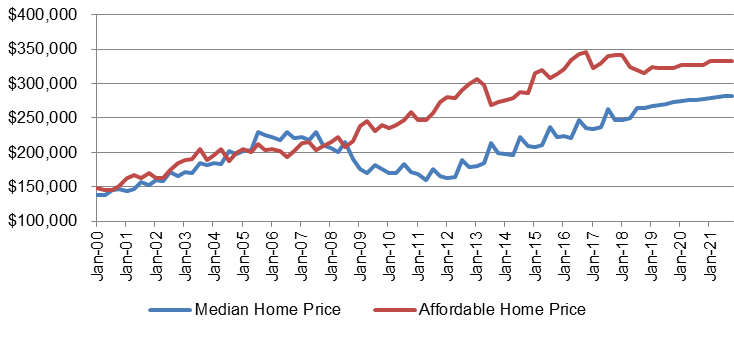
Source: NAR, US Census, Amherst Insight Labs, Amherst Pierpont. Note: Median home price reflects median US existing home sale price as reported by the National Association of Realtors.
Households look likely to hold onto their buying power. The Amherst Insight Labs Home Price Index forecasts annual national home price growth between 1.6% and 3.1% over the next three years while Amherst Pierpont Chief Economist Stephen Stanley’s forecast for real median income growth over the next three years is between 1.6% and 1.8%. Given the flatness of the yield curve, forward mortgage rates in the Amherst base case Pay Model Fair Value scenario are roughly in line with current rates over the same horizon. The combined effect of the convergence of the levels of home prices and income growth coupled with relatively stagnant mortgage rates suggest that there should be little change to affordability over the next few years. Based on these forecasts, quarterly measures of affordability should fall between 17.6% and 21.4% over the next three years.
Of course, a sharp rise in rates could cut affordability quickly. Every 100 bp rise in mortgage rates would cut the price premium that the median household could afford by roughly 10 percentage points. If mortgage rates rose above 6.5%, current levels of affordability would be completely erased, likely providing a significant headwind to home price growth.
Exhibit 3: Impact of changes in interest rates on affordability
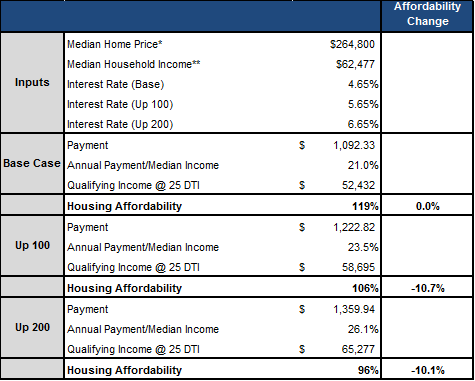
*National Association of Realtors US existing home sales median price NSA as of 8/31/18. ** Estimate based on 2017 median household income and assuming y/y growth rate of 1.8%. Source: NAR, US Census, Amherst Pierpont. Note: Assumes 25% front end DTI on 80% LTV loan.
This material is intended only for institutional investors and does not carry all of the independence and disclosure standards of retail debt research reports. In the preparation of this material, the author may have consulted or otherwise discussed the matters referenced herein with one or more of SCM’s trading desks, any of which may have accumulated or otherwise taken a position, long or short, in any of the financial instruments discussed in or related to this material. Further, SCM may act as a market maker or principal dealer and may have proprietary interests that differ or conflict with the recipient hereof, in connection with any financial instrument discussed in or related to this material.
This message, including any attachments or links contained herein, is subject to important disclaimers, conditions, and disclosures regarding Electronic Communications, which you can find at https://portfolio-strategy.apsec.com/sancap-disclaimers-and-disclosures.
Important Disclaimers
Copyright © 2026 Santander US Capital Markets LLC and its affiliates (“SCM”). All rights reserved. SCM is a member of FINRA and SIPC. This material is intended for limited distribution to institutions only and is not publicly available. Any unauthorized use or disclosure is prohibited.
In making this material available, SCM (i) is not providing any advice to the recipient, including, without limitation, any advice as to investment, legal, accounting, tax and financial matters, (ii) is not acting as an advisor or fiduciary in respect of the recipient, (iii) is not making any predictions or projections and (iv) intends that any recipient to which SCM has provided this material is an “institutional investor” (as defined under applicable law and regulation, including FINRA Rule 4512 and that this material will not be disseminated, in whole or part, to any third party by the recipient.
The author of this material is an economist, desk strategist or trader. In the preparation of this material, the author may have consulted or otherwise discussed the matters referenced herein with one or more of SCM’s trading desks, any of which may have accumulated or otherwise taken a position, long or short, in any of the financial instruments discussed in or related to this material. Further, SCM or any of its affiliates may act as a market maker or principal dealer and may have proprietary interests that differ or conflict with the recipient hereof, in connection with any financial instrument discussed in or related to this material.
This material (i) has been prepared for information purposes only and does not constitute a solicitation or an offer to buy or sell any securities, related investments or other financial instruments, (ii) is neither research, a “research report” as commonly understood under the securities laws and regulations promulgated thereunder nor the product of a research department, (iii) or parts thereof may have been obtained from various sources, the reliability of which has not been verified and cannot be guaranteed by SCM, (iv) should not be reproduced or disclosed to any other person, without SCM’s prior consent and (v) is not intended for distribution in any jurisdiction in which its distribution would be prohibited.
In connection with this material, SCM (i) makes no representation or warranties as to the appropriateness or reliance for use in any transaction or as to the permissibility or legality of any financial instrument in any jurisdiction, (ii) believes the information in this material to be reliable, has not independently verified such information and makes no representation, express or implied, with regard to the accuracy or completeness of such information, (iii) accepts no responsibility or liability as to any reliance placed, or investment decision made, on the basis of such information by the recipient and (iv) does not undertake, and disclaims any duty to undertake, to update or to revise the information contained in this material.
Unless otherwise stated, the views, opinions, forecasts, valuations, or estimates contained in this material are those solely of the author, as of the date of publication of this material, and are subject to change without notice. The recipient of this material should make an independent evaluation of this information and make such other investigations as the recipient considers necessary (including obtaining independent financial advice), before transacting in any financial market or instrument discussed in or related to this material.
Important disclaimers for clients in the EU and UK
This publication has been prepared by Trading Desk Strategists within the Sales and Trading functions of Santander US Capital Markets LLC (“SanCap”), the US registered broker-dealer of Santander Corporate & Investment Banking. This communication is distributed in the EEA by Banco Santander S.A., a credit institution registered in Spain and authorised and regulated by the Bank of Spain and the CNMV. Any EEA recipient of this communication that would like to affect any transaction in any security or issuer discussed herein should do so with Banco Santander S.A. or any of its affiliates (together “Santander”). This communication has been distributed in the UK by Banco Santander, S.A.’s London branch, authorised by the Bank of Spain and subject to regulatory oversight on certain matters by the Financial Conduct Authority (FCA) and the Prudential Regulation Authority (PRA).
The publication is intended for exclusive use for Professional Clients and Eligible Counterparties as defined by MiFID II and is not intended for use by retail customers or for any persons or entities in any jurisdictions or country where such distribution or use would be contrary to local law or regulation.
This material is not a product of Santander´s Research Team and does not constitute independent investment research. This is a marketing communication and may contain ¨investment recommendations¨ as defined by the Market Abuse Regulation 596/2014 ("MAR"). This publication has not been prepared in accordance with legal requirements designed to promote the independence of research and is not subject to any prohibition on dealing ahead of the dissemination of investment research. The author, date and time of the production of this publication are as indicated herein.
This publication does not constitute investment advice and may not be relied upon to form an investment decision, nor should it be construed as any offer to sell or issue or invitation to purchase, acquire or subscribe for any instruments referred herein. The publication has been prepared in good faith and based on information Santander considers reliable as of the date of publication, but Santander does not guarantee or represent, express or implied, that such information is accurate or complete. All estimates, forecasts and opinions are current as at the date of this publication and are subject to change without notice. Unless otherwise indicated, Santander does not intend to update this publication. The views and commentary in this publication may not be objective or independent of the interests of the Trading and Sales functions of Santander, who may be active participants in the markets, investments or strategies referred to herein and/or may receive compensation from investment banking and non-investment banking services from entities mentioned herein. Santander may trade as principal, make a market or hold positions in instruments (or related derivatives) and/or hold financial interest in entities discussed herein. Santander may provide market commentary or trading strategies to other clients or engage in transactions which may differ from views expressed herein. Santander may have acted upon the contents of this publication prior to you having received it.
This publication is intended for the exclusive use of the recipient and must not be reproduced, redistributed or transmitted, in whole or in part, without Santander’s consent. The recipient agrees to keep confidential at all times information contained herein.


