


Uncategorized
The emerging non-agency MBS market landscape
admin | September 21, 2018
This material is a Marketing Communication and does not constitute Independent Investment Research.
Although the market for new non-agency MBS still runs well below volumes before the 2008 financial crisis, it has recently started to tap a new set of issuers and a new set of loans. Some of the largest issuers focus on the strongest prime loans while others focus on a wide swath of other loans – often comingled and branded with different and unfamiliar labels.
The issuers and the loans they bring to market seem best distinguished by a few things: their loan credit quality, their loan size and eligibility for agency MBS securitization, and by features that determine if the loan is a Qualifying Mortgage. These criteria help filter the current universe of new non-agency loans into a handful of categories, and those categories help distinguish the most active non-agency MBS issuers from each other. While the market often brands a deal, shelf or issuer as simply ‘prime’ or ‘non-QM,’ the reality is the new non-agency market is rarely homogeneous and investors may be exposed to multiple different types of loans in a single transaction. Given this, we offer an alternative to these often inaccurate monikers.
The universe of new non-agency loans falls into a handful of categories:
- Prime agency conforming
- Prime jumbo agency conforming
- Prime jumbo non-agency
- Prime non-QM
- Non-prime non-QM
The largest issuers that bring these loans to market in turn fall into a few categories, too:
- Mainly prime, such as JPMMT, SEMT, CSMC, FSMT and PSMC
- Mainly non-prime, such as COLT, DRMT, AOMT and VERUS, and
- Hybrids, such as ARRW and GLTN
A good map should help investors navigate these new loans and issuers.
A new look in MBS issuance
Recent non-agency securitizations mark the first time in the last decade that there has been a steady stream of issuance of newly originated loans as opposed to holdovers from the legacy market. According to Inside Mortgage Finance, lenders originated $160 billion of jumbo and expanded credit loans through the first half of this year. Of that amount, around 10% made its way into non-agency deals. The current securitization model reflects a number of influences. For one, Fannie Mae and Freddie Mac have raised guarantee fees on some loans to levels where private securitization can compete. For loans outside agency guidelines, originators without the ability to hold the whole loan in portfolio have chosen to use securitization for financing and risk transfer. Non-prime and non-QM players, who usually cannot hold whole loans in a portfolio, also have used securitization for financing and risk transfer.
Filtering by credit
The credit of the latest generation of loans varies from extraordinarily high to well below prime. The strongest prime loans often end up either in agency MBS or bank portfolios, with some flowing into non-agency MBS. Agency eligible loans may flow to private label execution given more granular risk-based pricing
Loans that fall outside the prime box usually fall short of ‘hyper-prime’ standards of perfect pay histories, greater than 740 FICOs and less than 75 LTVs and for some reason cannot be delivered into government or GSE execution. According to a recent KBRA analysis[1] there are five criteria that non-prime loans generally exhibit one or more of:
- Expanded Prime: Exhibits 660 to 750 FICOs with small variances in LTV DTI or payment history versus prime collateral
- Prior Credit Event (PCE): A recent foreclosure, bankruptcy, deed-in-lieu or short sale which is more recent than allowed under GSE guidelines which can be anywhere from two to seven years based on the event
- Alternative Documentation: Income and asset verification that varies from Appendix Q requirements. Quite commonly, this involves the use of one to two years of bank statements in lieu of tax returns
- Business Purpose: Loans for 1-4 family rental properties outside the purview of GSE lending
- Foreign Nationals: Borrowers without a FICO score or credit report due to a lack of permanent US residence
Filtering by loan size
Not surprisingly, loan size matters. Some loans that fall under the Fannie Mae and Freddie Mac limits of $453,100 will still end up in new non-agency MBS if high guarantee fees make private securitization competitive. In most cases, however, reasonable guarantee fees and pricing on MBS make agency execution best. Above $453,100 but below $625,000, high guarantee fees also have made private execution competitive. Above $625,000, the agency option disappears and originators compete with bank portfolios. For nonbank originators able to source non-agency jumbo loans, securitization offers financing and risk transfer.
Filtering by QM requirements
The term Qualified Mortgage entered the MBS lexicon with rules introduced in January 2013. Policymakers put rules in place to ensure that borrowers only take out loans they are able to repay. The rules also gave lenders certain protections for making relatively more conservative loans.
Under the QM rules, a loan can fall into one of three categories, QM Safe Harbor, QM Rebuttable Presumption, also known as Higher Priced QM (HPQM) and non-QM mortgages. The categories ultimately determine whether the originator has met a standard in determining a borrower’s Ability to Repay (ATR), what legal protections an originator is afforded to if a loan defaults and whether an issuer is required to retain risk when the loan is securitized.
Broadly speaking, a loan must meet all the following criteria to get a QM designation.
- It must be fully amortizing with no interest-only period, negative amortization, balloon payments or maturity beyond 30-years
- It must be a fully-documented loan with verified income or assets
- It cannot carry greater than 3% in points and fees
- The borrower must be qualified using the highest possible monthly payment in the first five years of the loan
- It cannot exceed a 43% back-end DTI absent GSE execution
All Qualified Mortgages are presumed to be in compliance with the Ability to Repay requirements. In the QM Safe Harbor framework, the borrower is unable to challenge whether the lender satisfied their burden to qualify the borrower under the ATR rules. A Safe Harbor loan cannot carry a rate more than 1.5% points above the Average Prime Offer Rate (APOR), a survey-based estimate of APRs offered on prime mortgage loans.
Higher Priced Qualified Mortgage (HPQM) loans have rates more than 1.5% above APOR for conforming loans and 2.5% for jumbo loans and carry less legal protection than Safe Harbor loans since the borrower can challenge the presumption that the originator satisfied the ATR; to successfully challenge, borrowers need to demonstrate they do not have sufficient residual income to meet living expenses after paying their mortgage and other related costs. Issuers are not required to retain risk when they securitize Safe Harbor or Rebuttable Presumption Qualified Mortgages. Loans that fall short of these criteria for one reason or another would fall into the category of non-QM. Loans on investor properties are not consumer loans and as a result do not fall under the purview of the QM rules. As a result they do not receive relief from risk retention requirements.
Exhibit 1: A shapshot of ATR & QM requirements
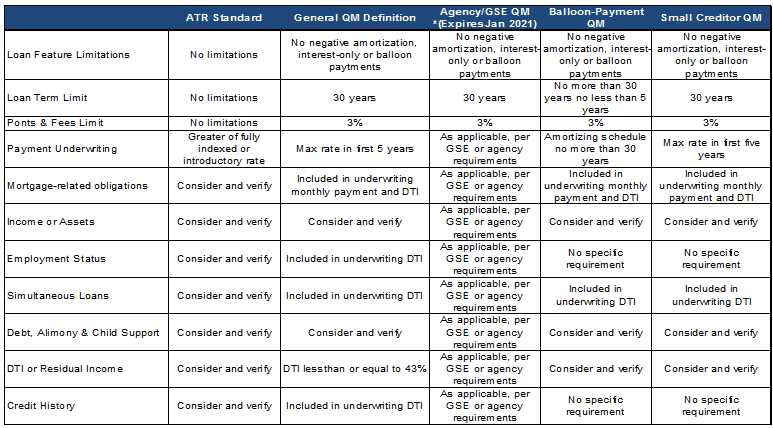
Source: CFPB, APS Note: The GSE ‘patch’ which allows them to securitize loans that are by definition non-QM without risk retention is set to expire January 10, 2021.
The rules went into effect in January 2014 and, despite significant focus among market participants on non-QM lending, origination volumes remained muted for a host of reasons. One initial concern among originators was that while the QM rules offer bright line guidance, the broader ATR construct does not. The ATR rules require originators to consider eight criteria including employment, income, assets and debt obligations. Determining ATR can be a fairly simple exercise when writing a Qualified Mortgage as the originator usually follows GSE, FHA or comparable agency underwriting guidelines. But when an originator steps outside the QM box then the rules become far less clear, other than the obligation to make a good faith determination that the borrower can repay the loan. Non-QM volumes remained constrained as originators established best practices for qualifying borrowers, walking the line between being sufficiently wide to capture good borrowers who couldn’t meet QM standards and sufficiently narrow to mitigate their potential legal exposure.
A 5-star taxonomy
Given that new non-agency loans can seem like a veritable Star Wars cantina of collateral, some way to simplify the world seems in order. A set of six rules can classify the loans into five buckets. The buckets are:
- Prime agency conforming
- Prime jumbo agency conforming
- Prime jumbo non-agency
- Prime non-QM
- Non-prime non-QM
Admittedly there are limitations to this taxonomy and at a practical level there is more gradation across issuers and programs including expanded prime, near-prime and non-prime designations. Additionally this taxonomy does not capture Safe Harbor versus Rebuttable Presumption QM loans based on rate. Nor does it account for the non-QM patch which allows otherwise non-QM high DTI loans to be wrapped by the GSEs. Additionally, GSE delivery requires that loans be underwritten using the GSEs proprietary underwriting systems, Fannie Mae’s Desktop Underwriter and Freddie Mac’s Loan Prospector. While some issuers disclose whether a loan has been underwritten to agency guidelines, not all do. Given this lack of disclosure, loans may fall into an agency conforming or jumbo conforming bucket based on other defining characteristics but may not have been underwritten by the GSEs. While the taxonomy may have some limitations, it is effective in capturing the different collateral profiles. The rules behind the 5-star taxonomy are below.
Exhibit 2: Defining the APS new production taxonomy
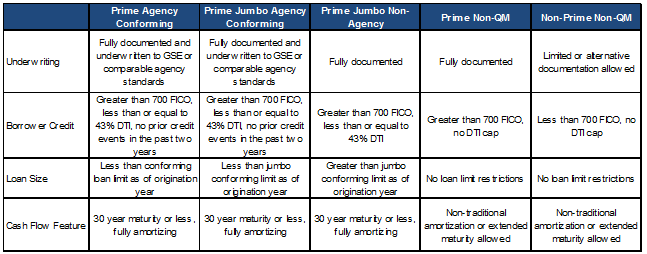
Source: APS
This taxonomy is applied to shelves that have issued at least a cumulative $500 million since 2014. After applying this taxonomy, the first thing that jumps out is the lack of homogeneity of collateral within a given shelf. Even shelves like Redwood’s SEMT, which is generally viewed as prime jumbo issuance has over 9% in non-QM loans and another 8.5% in prime jumbo agency conforming loans. Additionally, there are significant populations of prime loans in ‘non-QM’ shelves like AOMT, COLT, Deephaven and Verus.
Additionally, mainly prime issuers tend to by and large be more highly regulated entities like banks and insurance companies while mainly non-prime shelves are sponsored by more loosely regulated ones. Hybrid issuers tend to be sponsored by asset managers. Mainly prime issuers are marked by an overwhelming majority of non-agency prime jumbo collateral. Non-prime issuers have a disproportionately large amount of non-prime non-QM loans. Hybrid issuers vary but can often have meaningful concentrations of both loan types.
Exhibit 3: Shelf level collateral distribution by APS taxonomy
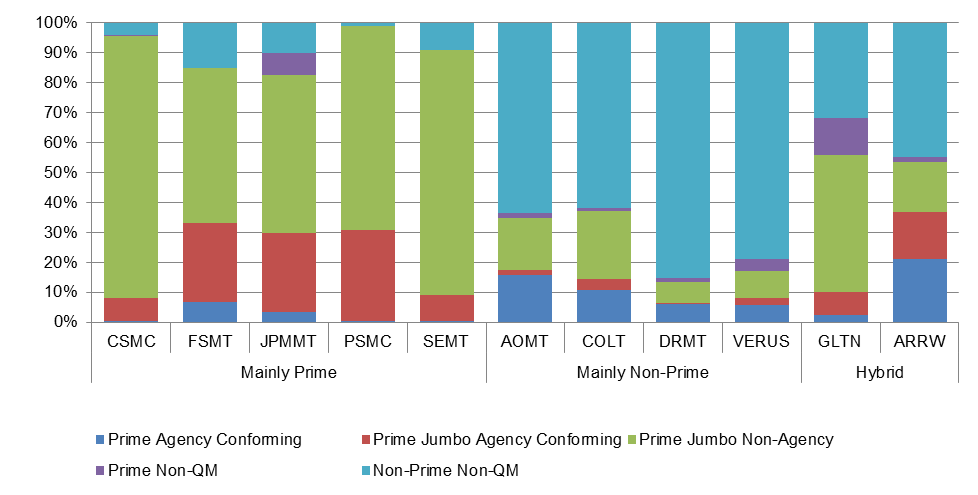
Source: Amherst Insight Labs, APS Note: Based on issuance January 2014 to current assuming a $500 million UPB issuance cutoff.
Issuance to date has been dominated by prime jumbo non-agency and prime jumbo agency conforming collateral. Of the nearly $42 billion in deals analyzed, almost 60% involved prime jumbo non-agency collateral while prime jumbo agency conforming contributed another 15% of overall issuance. Non-QM collateral across prime and non-prime profiles contributed another 22% to overall issuance.
Exhibit 4: Total issued volume by shelf and APS taxonomy
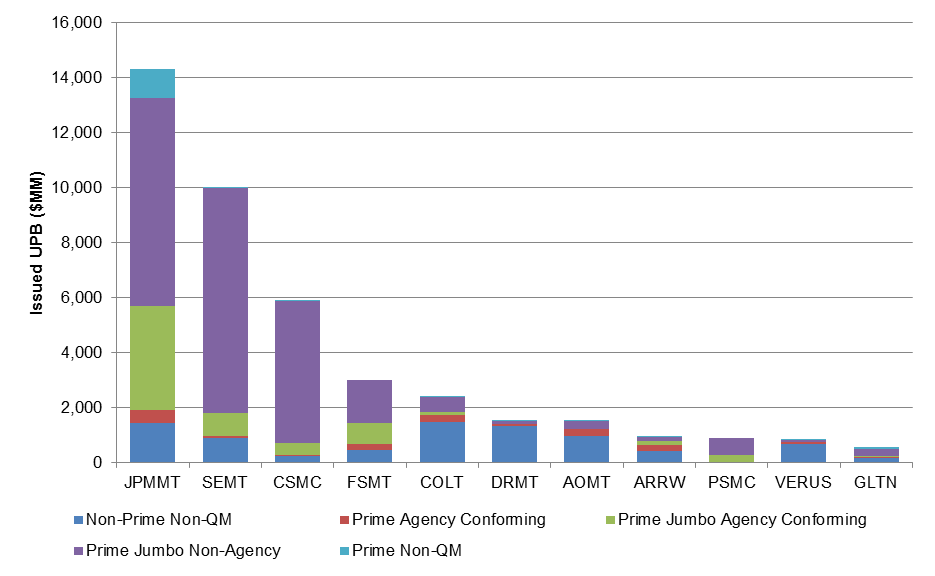
Source: Amherst Insight Labs, APS Note: Based on issuance through January 2014 to current assuming a $500 million UPB issuance cutoff.
Issuance by non-prime and hybrid issuers through the first half of this year has nearly doubled all of last year’s production. We estimate issuance volumes of roughly $7 billion to date and forecast total issuance of $10 billion for the full year. The uptick in securitization has likely been fueled in part by the steady grind tighter in spreads across the capital structure since the beginning of 2017.
Implications of the GSE patch
Securitization of non-QM loans through private label execution is likely to remain contained over the next two years but may grow exponentially in 2021 when the GSEs’ QM exemption is set to expire. Under the QM rules, loans with greater than 43% back end debt-to-income (DTI) ratio are non-qualified mortgages and require risk retention unless they are securitized by a GSE. Since changing certain underwriting criteria last September, the percentage of high DTI loans in GSE originations has increased materially, totaling more than 30% of total production at both Enterprises earlier this year. If the GSE exemption expires, some or all of these loans could go to non-QM securitizations. If home prices and wages continue to decouple, high DTI loans as a percentage of overall originations will continue to increase, likely further fueling non-QM origination volumes.
While still more than two years away, the expiry of the GSE patch is already a contested topic. Not dissimilar to arguments about decreasing GSE loan limits, those in favor of the GSE patch going away see it as a means to reduce the size of the GSE footprint and the government’s already outsized role in mortgage lending. Those opposed to eliminating the patch point to the potential for the cost of credit to increase materially for the borrower if all these loans needed to find a home in the private label market. Under the current rules, FHA lending is capped at a 43% back end DTI, and, absent a change there, high DTI loans could not flow into Ginnie Mae execution if the patch expires.
Exhibit 5: High DTI loans continue to grow at the GSEs
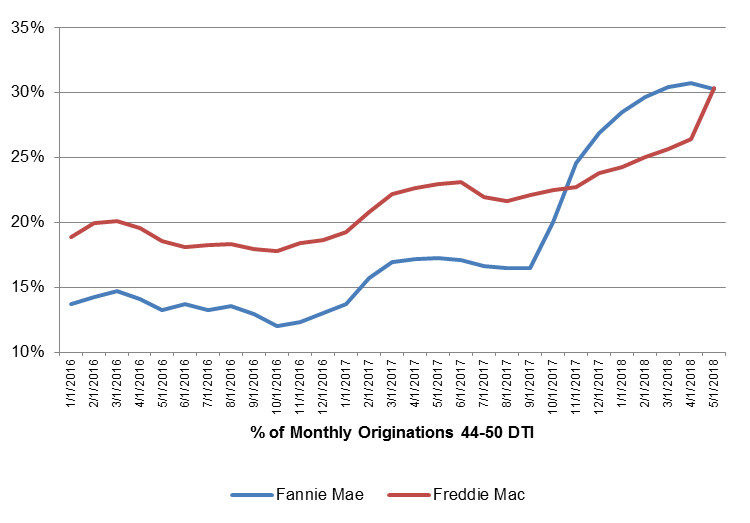
Source: Fannie Mae, Freddie Mac, Amherst Pierpont
Prepayment and credit performance in new non-agency MBS
Performance across prime agency and non-agency collateral has been marked by generally pristine credit performance and more predictable rate-driven prepayments. Despite higher loan balances, non-agency jumbo loans have paid roughly in line with their agency jumbo conforming counterparts. Prepayments across non-prime collateral have been marked by lightning fast speeds and relatively benign credit performance. Comparing non-prime prepays versus prime agency conforming and non-agency jumbo collateral shows that they were faster than all those loan types in lower rate environments and remain elevated despite higher rates. Much of this can be attributed to an overall tightening of loan spreads and subsequent refinancing of borrowers in the pool. For example, 8.2% of the loans in AOMT 2018-2 are loans that were previously securitized in AOMT 2015-1, according to a DBRS pre-sale report on the transaction.
There was a material spike in transition rates across both prime and non-prime shelves in the third quarter of 2017, especially concerning in non-prime shelves where rolling from MBA 30-day to 60-day delinquent status breached 5.0% on annualized basis in October of last year . Traditional default curves would imply an increase in delinquencies and defaults as the deal universe seasons but not to this magnitude. An analysis of the rolling delinquencies of all shelves shows disproportionately high transition rates in hurricane affected states.
Splitting the universe into loans from Texas, Florida and Puerto Rico versus the rest of the population of non-prime loans shows peak transition rates of 17.3% in October 2017 for states affected by hurricanes Harvey, Irma and Maria compared to 1.4% for the rest of the universe in that month. Transition rates on hurricane-affected prime loans mirrored that behavior albeit to lower absolute levels. Transition rates on prime agency conforming loans spiked to over 10% last November but had fallen to almost zero by the beginning of this year. Transition rates on hurricane affected agency jumbo conforming loans rose to roughly 5% and almost immediately reverted to near-zero.
Exhibit 6: Speeds in non-prime remain fast versus other credits
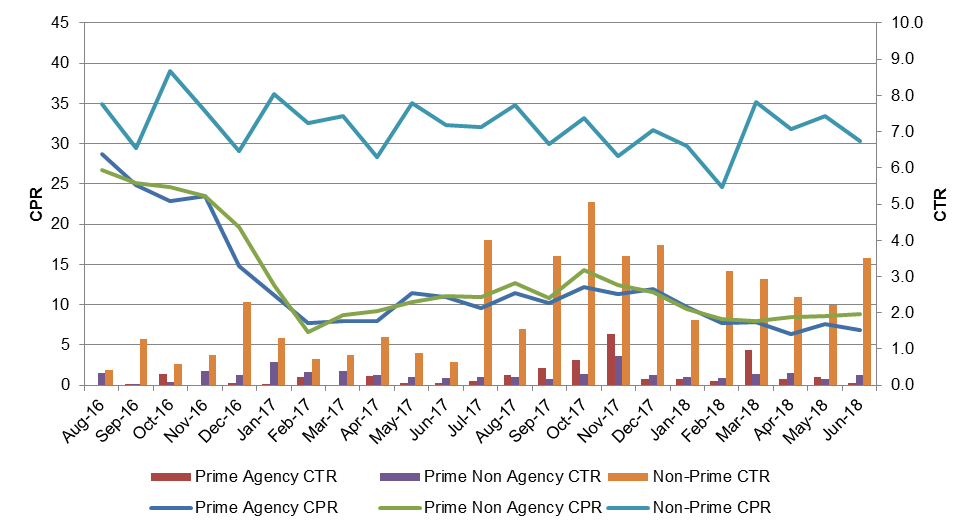
Source: Amherst Insight Labs, Amherst Pierpont
The Players
Mainly Prime
The majority of prime issuance is dominated by highly regulated and traditional players like banks, REITs and mortgage originators. And they generally securitize the cleanest loans. For pre-crisis issuers, this is in no small part an attempt to mitigate legal exposure they may have incurred as a result of pre-crisis deals. Legacy investors will recognize the JPMMT, SEMT and CSMC shelves as holdovers from the pre-crisis market. Newer entrants include Flagstar’s FSMT shelf and in a complete departure from the pre-crisis era, insurance companies are also contributing to prime issuance. We break the mainly prime issuers into two categories – legacy players and new entrants.
Legacy Players
Legacy players who have continued to issue post crisis are generally marked by remarkably consistent and clean collateral profiles. For example, average FICOs on JP Morgan’s most recent JPMMT deal are actually a basis point higher than their first deal of 2014 with average LTVs roughly 1.5 points lower on its most recent transaction. All their issuance to date has been 100% full doc and while average DTIs have crept up from the high 20s to the mid-30s over time, they continue to be well below the QM threshold. Credit Suisse’s CSMC shelf looks remarkably similar to JPMMT. Deals are 100% full doc with high average FICOs and lower average DTIs. While legacy bank shelves are by and large remarkable as a function of their consistency, Redwood has taken the somewhat novel approach of splitting issuance into what can be categorized as ‘hyper-prime’ and prime buckets. While all deals are issued under its SEMT shelf, prime issuance, characterized by the securitization of wider swath of credits, carries the additional series designation of ‘CH’ representing their Choice QM program.’ Redwood’s ‘hyper-prime’ deals that do not carry the CH have average FICOs in the high 700s, LTVs in the mid-60s, are 100% full doc and primary residences generally make up more than 90% of the pools.
New Entrants
New participants include Flagstar, AIG and TIAA. Flagstar has issued seven deals since the beginning of 2017 off its FSMT shelf. Of those, six deals were comprised of mixed prime collateral as well as a deal fully collateralized by investor loans. AIG has issued three prime transactions totaling $1.25 billion this year off their Pearl Street Mortgage Company (PSMC) shelf. AIG, through its subsidiaries, acts as aggregator and sponsor of these transactions, acquiring loans from a large channel of originators. AIG previously acted as sponsor on two CSMC transactions in 2017 TIAA has issued one transaction mainly prime transaction this year under their TBMLT shelf. TIAA originated 100% of the collateral through their affiliate TIAA FSB.
While overall credit standards have remained remarkably consistent across mainly prime issuers, there have been some notable developments recently. Namely the increased inclusion of agency eligible loans in private label trusts. Securitization of agency eligible loans was common practice in pre-crisis. However it was commonly in the form of a conforming group in a multi-group deal where the conforming group would be sold to the GSEs as part of their mandate to support subprime borrowers. Today, GSE eligible loans are being securitized in private label trusts largely because the non-agency market offers more favorable execution that selling the loans to the GSEs. The overwhelming majority of loans going to private label execution either trade back of TBA or carry hefty loan level pricing adjustments. One issuer that has been particularly active in securitizing conforming, conforming jumbo and investor loans is Flagstar. Of their over $1 billion in issuance last year, 71% were prime jumbo non-agency loans while agency conforming and jumbo conforming loans comprised just 19% of volumes. The composition of their issuance has changed materially this year. Flagstar has nearly doubled last year’s issuance with a far larger percentage of agency conforming and jumbo conforming loans which have grown to 40% of their 2018 issuance.
Exhibit 7: Conforming loans increasing in Flagstar issuance
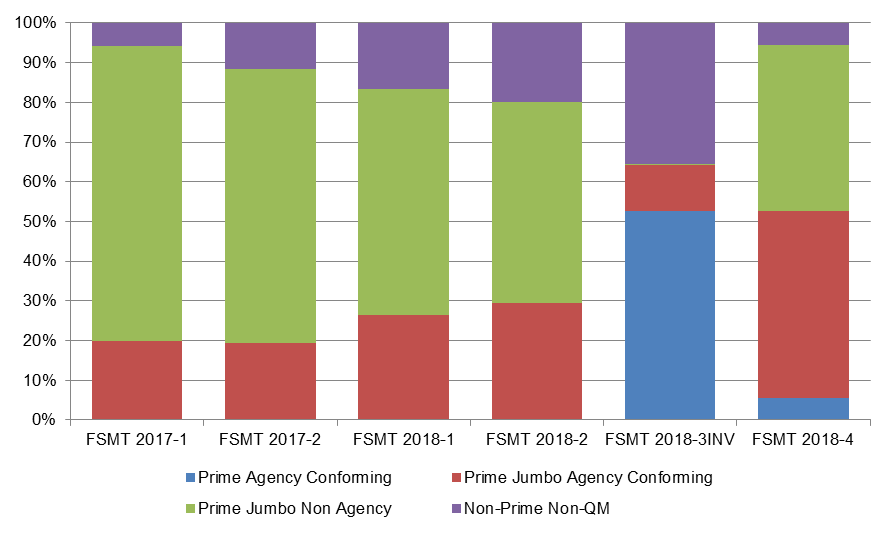
Source: Amherst Insight Labs, APS
While mainly prime issuance is by and large populated by more traditional players, sponsors of non-prime transactions tend to be less so. Given the unfamiliarity with the players involved, less homogenous collateral profiles and migration of those collateral profiles over time they warrant a more in-depth analysis. An analysis of the business models of non-prime sponsors suggests two primary business models; financing for production from captive affiliates or financing for production from correspondents.
Mainly Non-Prime
AOMT: Angel Oak Mortgage Trust, Sponsor Angel Oak Mortgage Solutions
Angel Oak Mortgage Solutions is the lending subsidiary of the Angel Oak companies which include both an asset management and capital markets business in addition to their single family mortgage lending arm that originates government, GSE as well as non-conforming mortgage loans as well as a separate commercial real estate lending platform. Angel Oak began issuing in 2015 and has issued approximately $1.65 billion across eight transactions.
Roughly 82% of the collateral contributed to the deals over the life of the program has been non-QM. Angel Oak originates the overwhelming majority of its collateral through its captive affiliates using eight different programs for
borrowers who do not qualify for government, conventional or bank portfolio financing for a host of reasons including documentation, income, recent delinquency as well as other issues. It’s important to note that just because a borrower is ‘non-prime’ doesn’t automatically make him ‘non-QM.’
Despite a high concentration of non-QM collateral, DTIs are well below the QM threshold, averaging 36% across the life of the program. Low DTIs may be a mitigating factor for higher amounts of limited documentation loans. Per DBRS, the percentage of full documentation loans in AOMT transactions have declined from 68% in their 2017-1 deal to just over 30% in their 2018-3 transaction. Additionally, as full doc loans have decreased, average FICO scores have increased, improving by roughly 15 points between the 2017-1 and 2018-3 transactions. Angel Oak generally exhibits some of the lowest average loan balances of all major non-QM programs. Unsurprisingly, as home prices have risen, the average loan size of the deals has increased 36% since their inaugural transaction. Diversification has continued to improve over time as the top three states represented 63% of collateral versus 82% of their inaugural transaction. Given Angel Oak’s footprint there are a disproportionately large amount of loans in Georgia and specifically in the Atlanta CBSA.
COLT: COLT Mortgage Loan Trust, Sponsor: LSRMF Acquisitions I, LLC
The COLT program is backed by Lone Star Funds, a private equity and asset management firm and their affiliate Caliber Home Loans, a full service mortgage company that originates and services government, conforming and non-conforming residential mortgages. The COLT program began in 2015 and has issued over $2 billion across nine transactions.
Non QM loans have made up approximately two-thirds of total COLT issuance with the remainder collateralized by Rebuttable Presumption ‘HPQM’ loans. The proportion of non-QM loans in these deals have been steadily increasing over time. Non-QM loans made up less than half of non-QM deals and have been greater than 70% of total collateral in recent transactions. Almost all COLT collateral is originated through their affiliate Caliber Home Loans or Sterling Bank and Trust through six programs. All loans originated through Caliber have had assets, income and employment verified in accordance with documentation requirements for determining debt and income under Appendix Q[1] of the ATR rules. Borrowers in Caliber’s programs have typically had some previous credit event. Loans originated by Sterling generally exhibit better credit and lower LTVs, partially offset by less stringent documentation requirements.
Average FICOs tend to drift deal to deal based on the population of Sterling loans in the deal, as a higher percentage of higher FICO Sterling loans will push the average FICO higher. This is also the case when looking at CLTVs as greater concentrations of Sterling loans will push average CLTVs lower. Despite what appear to be better overall credit metrics in deals with large concentrations of
Sterling loans, single B loss estimates are roughly a point higher than deals with no Sterling loans, likely attributable to greater expected losses on lower documentation loans. Consistent with the migration towards more non-QM loans, DTIs have crept up over time in the program. The initial transaction had a DTI of less than 35% while more recent ones have hovered around the 43% DTI cutoff for Qualified Mortgages.
DRMT: Deephaven Residential Mortgage Trust, Sponsor: Deephaven Mortgage LLC
Deephaven Mortgage was founded in 2012 and acquired in 2014 by Varde Partners, a global investment manager. Deephaven is licensed to originate loans in 48 states but to date has acted solely an aggregator, acquiring loans through correspondent channels. Their deals are often partially or entirely collateralized by loans originated by Angel Oak and Impac as well as several other smaller originators. Deephaven has issued roughly $1.5 billion across seven transactions.
At 86%, Deephaven has the highest percentage of non-QM loans in their deals relative to all other issuers. The remaining collateral has consisted of loans that are exempt from the ATR framework, such as loans made on investor properties. Deephaven offers five unique programs ranging from an expanded prime program where borrowers must have a minimum 660 FICO and need to be at least four years removed from a previous credit event to a non-prime program where borrowers must have a minimum FICO score of 500 and can have had a recent credit event. They also offer unique programs for investors and foreign nationals.
Despite having the largest population of non-QM loans, Deephaven deals maintain relatively low DTIs, consistently in the range of 35-36%. The shelf has seen a meaningful increase in credit scores over time, with average FICOs rising 40 points since initial issuance. However increasing FICOs may be a compensating factor for rising amounts of limited documentation loans which have roughly doubled to 40% in recent transactions. Despite this, average WACs and ARM margins have compressed. Deephaven has the lowest average loan balances of any major non-QM issuer, averaging just under $365,000 but average loan sizes have nearly doubled since program inception from $225,000 to $408,000 in their first transaction of this year.
VERUS: Verus Securitization Trust, Sponsor: Invictus Residential Pooler LP
Since the beginning of 2017, the VERUS shelf has issued $1.6 billion across six transactions. The VERUS shelf is backed by Verus Mortgage Capital an affiliate of the investment management firm Invictus Capital Partners. Similar to Deephaven, Verus aggregates collateral for their deal through correspondent channels.
The Verus shelf exhibits a relatively low amount of non-QM loans relative to other issuers, averaging 58% across the shelf. Verus aggregates collateral through three programs. The remainder is primarily comprised of loans not subject to ATR loans such as investor properties or loans issued prior to the ATR rules taking effect. Given the relatively low average WALA on the deals, any exempt collateral are likely investor loans. Verus offers both Appendix Q full documentation and limited documentation options which rely on 12 to 24 months of bank statements in their Credit Ascent program. While the total amount of limited documentation loans is not available for all deals, the percentage of 24-month bank statement loans are generally elevated across the shelf. Barring their 100% investor property deals, bank statement loans make up at least a third and as much as 60% of loans backing the deal. The Verus shelf also generally exhibits a higher percentage of cash-out refis than other shelves with those loans making up more than 40% of collateral in certain trusts. Higher percentages of cash-out refinancings appear to be compensated for with lower average CLTVs. Average CLTVs across the Verus shelf are roughly ten points lower than those of other major non-QM issuers.
Hybrid and Other Players
ARRW: Arroyo Mortgage Trust, Sponsor: Arroyo Mortgage Acquisition Co. I, LLC
Arroyo Mortgage Acquisition Co. is an affiliate of Western Asset Management Company (WAMCO). Non-QM securitization appears to be a part of the asset manager’s broader Diversified Loan Opportunities Strategy. Per the fund’s portfolio managers, the new banking regulatory framework has stymied the flow of capital into residential, commercial and consumer lending both domestically and in Europe and the fund looks to provide capital to high quality lending opportunities across those asset classes.[1] This strategy of disintermediation is a departure from the role of the traditional asset manager and may become increasingly prevalent absent a relaxation of bank regulations and subsequent expansion of the credit box.
Arroyo/WAMCO’s inaugural transaction was the largest non-QM deal done to date, eclipsing the $1 billion mark. The deal exhibited a somewhat heterogeneous collateral profile given the fact that it was collateralized by a large amount of highly seasoned pre-ATR loans coupled with more recent originations. Further compounding the collateral diversity is the fact that the aggregator did not employ a uniform set of purchase guidelines. Instead loans were underwritten to each individual originator’s guidelines which the aggregator had approved prior to purchasing the loans
As ‘non-QM’ has become a catch all phrase for all things that don’t fit into the narrow definition of prime jumbo there are a handful of other issuers that get lumped in with we categorize as non-prime players. Certain prime jumbo issuers have widened their credit boxes modestly and are issuing ‘near-miss’ prime deals which are commonly referred to as non-QM.
Shelves like Galton’s GFMT shelf and Redwood’s SEMT ‘CH’ shelf exhibit significantly higher average credit scores, lower ARM concentrations, and much higher average loan balances than non-prime shelves. These shelves also have reasonably high concentrations of QM ‘Safe Harbor’ loans, the most stringent form of QM lending. While these two programs maintain many similarities, they do have some key differences. The Galton program has a much lower percentage of purchase and much greater amount of cash out refi loans than the Redwood program. Additionally, while the Redwood program is 100% full documentation, the Galton program does have a modest population of limited documentation loans.
The Payment Waterfall
A side by side analysis of mainly prime issuers shows these shelves are by and large very similar with regards to pay rules. They all use a modified shifting interest structure where the deep subordinate classes are locked out to meet minimum credit enhancement tests. The senior bonds are pro-rata for seniority but are structured as both pass throughs and sequential classes for principal allocation. The deals are all very similar with regards to credit enhancement and allocation of losses.
Exhibit 8: A side by side comparison of mainly prime issuers
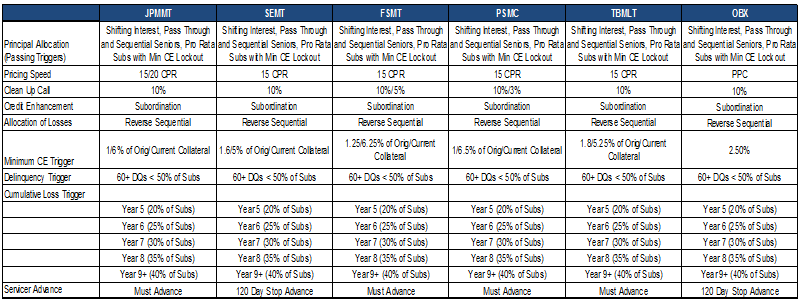
Source: Fitch Ratings, KBRA, DBRS, Bloomberg, Amherst Pierpont
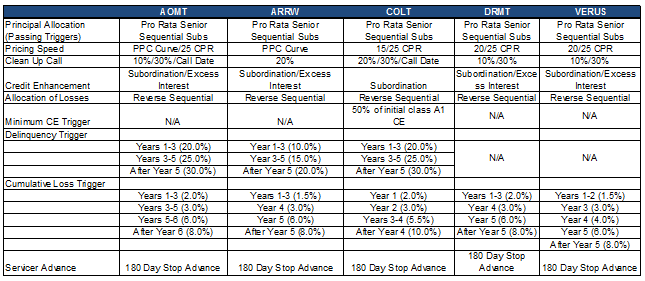
Non-prime deals by and large tend to be similar in terms of structure as well. All major mainly non-prime issuers use a hybrid shifting interest structure where the senior bonds pay pro-rata assuming the deal is passing triggers and the mezzanine and subordinate bonds pay sequentially once the pro rata seniors haven been entirely paid off. If a trigger is tripped, the seniors will pay sequentially from the most senior bond down.
Exhibit 9: A side by side comparison of mainly non-prime issuers
Source: Fitch Ratings, KBRA, DBRS, Bloomberg, Amherst Pierpont
Sources of credit enhancement vary modestly by issuer. Most issuers use a combination of both hard subordination and excess interest to reverse realized losses with the notable exception of the COLT shelf which does not use excess interest to pay back losses. All issuers allocate losses reverse sequentially from the most junior tranche outstanding up.
While all shelves employ a cumulative loss trigger that escalates over time, the absolute level of losses and intervals between escalators vary from shelf to shelf. Only the COLT shelf employs a minimum credit enhancement test which will lock all other classes out from receiving principal in the event that the AAA class’ credit enhancement drops to 50% or less than the initial enhancement level. Additionally, while Angel Oak, WAMCO and Caliber all employ both delinquency and cumulative loss triggers in their deals, Deephaven and Verus do not.
One particularly interesting development across issuers that have issued multiple transactions we have seen an increase in both pricing speeds and the remaining collateral balance outstanding before the deal can be called. The increase in pricing speed is an attempt to better align pricing with actual prepayment rates. The increase in the clean up call balance may be explained by a number of potential factors. First, it may be a function of the issuers’ view that loans may be worth more than par in the future if risk premiums continue to tighten. It could reflect the issuer’s desire to re-lever the outstanding collateral balance at the cleanup call into a new structure – potentially one with higher AAA advance rates if performance is strong and rating agencies have a more constructive view on the performance of the collateral in the future.
[1] KBRA: Credit Evolution: Non-Prime Isn’t Yesterday’s Subprime
[2] Appendix Q requires that when available, monthly debt and income should be verified in line with standards put forth by Fannie Mae, Freddie Mac, HUD, the VA, Department of Agriculture or the Rural Housing Service. Absent specific guidance from those entities, an originator can either (1) exclude the income or debt, or (2) rely on Agency or GSE guidance to resolve the issue
[3] https://www.westernasset.com/us/en/research/whitepapers/qa-diversified-loan-opportunity-strategy-2016-01.cfm