


Uncategorized
Ahead to the Fed’s new balance sheet normal
admin | September 21, 2018
This material is a Marketing Communication and does not constitute Independent Investment Research.
A back-of-the-envelope exercise suggests that the Fed may hit its targeted balance sheet size in late 2020 or early 2021, consistent with indications from Chairman Powell and others on the FOMC that the process that started in October last year may take three to four years to finish. The pace of runoff in Fed Treasury and MBS holdings is one big variable, and the target level for excess reserves is the other. Eventually the private supply of Treasuries, MBS and other safe assets will depend on the answer.
A year of balance sheet reduction
The Fed has allowed its holdings of Treasury securities and MBS to runoff for about a year. So far, the paced has been relatively restrained. By the end of September, the Fed will have shed around $150 billion in Treasuries and $120 billion in MBS. Thus the overall balance sheet, which was around $4.5 trillion a year ago, is still well over $4 trillion today.
Balance sheet assets
The pace of balance sheet reduction should accelerate going forward. The monthly caps will reach their ultimate peaks in October of $30 billion a month for Treasuries and $20 billion for MBS. In fact, those caps are so high that the Fed in most months will probably not have enough securities maturing or rolling off to hit those caps. If the caps were binding every month, the Fed would shed $600 billion—$360 billion of Treasuries and $240 billion of MBS—over the next 12 months. But balance sheet reduction looks likely to be considerably less rapid than that.
On the Treasury side, the pace of reduction is almost known with certainty. Maturities will wane over the next several years since the heaviest Fed buying during the several rounds of QE ending in 2014 came in the 5- to 10-year sectors. The pace of the Fed’s maturing securities should peak over the next 12 months and then taper down as time goes by. Based on the $30 billion monthly caps, which will typically bind in the refunding months of February, May, August, and November and not at all in other months, the Fed’s Treasury holdings will decline by around $287 billion over the next 12 months, then slow to around $230 billion over the October 2019-September 2020 period, and then to well under $200 billion in the following 12 months.
Projecting MBS runoff is much trickier as it depends mostly on predicting prepayments. Gross runoff has been in the neighborhood of $20 billion a month recently, but, given the ongoing rise in mortgage rates, is likely to slow down somewhat going forward. The dollar amount of runoff should also naturally moderate over time, even with constant prepayment speeds, since the size of the Fed’s MBS portfolio will diminish. In any case, based on the analysis of the APS MBS strategy team, MBS runoff should average about $16 billion a month over the next 12 months, $15 billion over the October 2019-September 2020 period, and $12 billion a month over the following 12 months.
The asset side of the Fed’s balance sheet is highlighted by securities holdings but also includes a handful of other items such as foreign currency and gold that add up to a small percentage of the total. Assuming no meaningful changes to the non-securities portion of the balance sheet, the projected evolution of the Fed’s assets is encapsulated in the table below.
Exhibit 1: Evolution of the Fed’s balance sheet assets
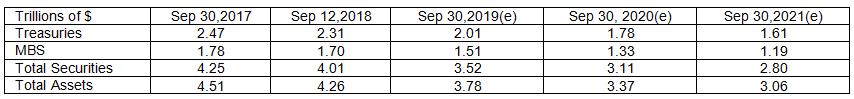
Source: Federal Reserve, APS calculations
Balance sheet liabilities
Meanwhile, in a normal environment, the liabilities side would grow in tandem with the economy. Usually the largest portion of the liability side of the Fed’s balance sheet is currency in circulation, which, in theory, should be rising with growth in the economy. Of course, the biggest liability currently is bank reserves, given the massive stockpile of excess reserves. There are other relatively small items, such as the Treasury’s cash balance account at the Fed, deposits by nonbanks (such as GSEs), reverse RPs carried out on behalf of foreign official accounts, and, up until recently, reverse RPs conducted with market participants (that program has dwindled to almost zero).
So, the evolution of the liability side of the balance sheet over time will consist of rising currency and required reserves offset by shrinking excess reserves. One key question for the balance sheet outlook is how much in excess reserves does the Fed want to have in the financial system permanently. This, in turn, will depend in large part on how the Fed chooses to conduct monetary policy operations. If it goes back to the pre-2008 model, excess reserves would be very close to zero, and the Open Market desk would inject or drain small amounts of reserves each day to clear the fed funds market as near as possible to the target. More likely, the FOMC will decide to maintain the current procedures, where the Fed pre-determines the amount of excess reserves in the banking system and uses IOER to help keep the funds rate within the target range. A number of policymakers have noted over recent years that regulatory burdens imposed since the 2008 financial crisis generate substantial demand for reserves to fulfill various capital and liquidity requirements. Thus, if the Fed chooses to preserve the current operating procedure, it will maintain a significant amount of excess reserves even after the balance sheet is right-sized.
To project the evolution of the desired size of the liability side of the Fed’s balance sheet, we need to make assumptions about two things: the growth in the demand for cash and the Fed’s eventual desired level of excess reserves. Currency in circulation over the past year has surged by around 7%, well in excess of nominal GDP growth, but the default assumption is usually that demand for cash increases at about the same rate as the economy. For our purposes, I will make the 5% assumption, keeping in mind that if currency grows at a 7% annual clip over the next few years, the desired level of balance sheet liabilities will rise about $30 billion per year faster.
Meanwhile, based loosely on what various Fed officials have said over the years, I will use three scenarios for the desired level of excess reserves: a baseline of $500 billion, a high scenario of $1 trillion, and a low scenario of $100 billion. The table below details the evolution of the desired size of the balance sheet with 5% growth in currency. I have assumed no meaningful changes in the other smaller liability items.
Exhibit 2: Desired liabilities level of the Fed’s balance sheet assuming 5% growth in cash demand under three scenarios for excess reserves
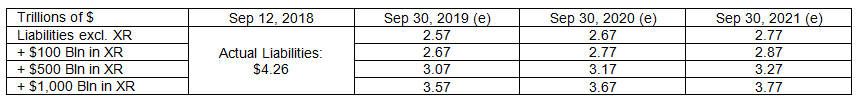
Source: Federal Reserve, APS calculations
When does the Fed right-size the balance sheet?
Estimating when balance sheet reduction will bring the securities holdings down to the desired level is now just a matter of noting when the series in our two tables meet. Combining the two tables into chart form:
Exhibit 3: Projecting the timing of Fed balance sheet normalization
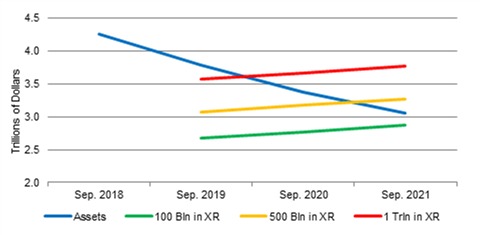
Source: Federal Reserve, APS calculations
As the chart shows, the balance sheet is still far too large today, but the lines begin to converge quickly as the pace of runoff picks up. In the baseline scenario, where the Fed decides to maintain around $500 billion in excess reserves, the balance sheet will be right-sized around the end of 2020. Of course, a higher level of resting excess reserves leads to an earlier convergence, and a lower figure would require a longer period of runoff; the two alternatives above suggest convergence about a year earlier/later than the baseline. As a result, it is clear that the FOMC needs to decide what it wants to do with excess reserves sooner rather than later, and Chairman Powell noted during the summer that the Committee would need to take up that debate in earnest again in the fall.
Phase II of balance sheet normalization
Even if the convergence occurs in September 2021, the Fed at that time will hold about $1.6 trillion in Treasuries and $1.2 trillion in MBS. However, Fed officials have been virtually unanimous in stating that the Fed’s holdings should ultimately be Treasuries only.
Thus, once the balance sheet is right-sized, the markets desk at the New York Fed will have to shift gears and manage the composition of the balance sheet. Presumably, the Fed will allow the MBS portfolio to continue to run off, but at that point, it will replace the MBS runoff with Treasuries purchases. Thus, after the point of convergence, the influence on the MBS market will be the same, but the Fed will flip from being a net seller of Treasuries to a net buyer. In fact, the pace of purchases will be the sum of MBS runoff plus natural growth in liabilities (currency and required reserves). While this reversal is likely a few years away, it could have a noticeable influence on the Treasury market when it does occur, as the Fed could go from running off around $150 billion per year of Treasuries to net annual purchases of near that amount.