Uncategorized
Darden cheap to McDonalds
admin | September 14, 2018
This material is a Marketing Communication and does not constitute Independent Investment Research.
Darden Restaurants has completed debt reduction, reducing leverage into their target range. Positive fundamentals should be reflected in earnings to be reported on September 20. Darden’s long-end debt looks particularly cheap relative to that of McDonald’s, and has room to outperform.
Leverage within target range
Darden Restaurants (DRI) will report fiscal 1Q19 results on September 20, 2018. Since the company last reported results on June 21, 2018, the credit has been relatively quiet from a headline perspective. Furthermore, August was a quiet month on the hurricane front, which bodes well for same store sales (SSS) at DRI. With debt reduction now complete and leverage of 2.15x comfortably within management’s 2.0x-2.5x target range, DRI will step up shareholder remuneration slightly. Management increased its annual share repurchase target by $50 million, to the $150 -$250 million range. For fiscal 2018, DRI generated $605 million of free cash flow and returned $548 million to shareholders. Had DRI increased share repurchases by $50 million, shareholder remuneration still would have been within the confines of free cash flow generation.
Outperforming peers
DRI posted SSS growth of 2.4% in fiscal 4Q18, beating street estimates of 1.2%. Both Olive Garden and Longhorn Steakhouse, DRI’s two largest banners, witnessed SSS growth of 2.4% in the quarter. The 4Q18 marked Olive Garden’s 15th consecutive quarter and Longhorn’s 21st consecutive quarter of SSS growth. Both banners also outperformed the benchmark index by 190bps. In fact, all of DRI’s banners witnessed positive SSS growth with the exception of Cheddar’s, which declined by 4.7%. The decline largely reflected the acquired franchise restaurants, which posted a decline of 7.0% relative to a decline of 3.3% at the original company restaurants. DRI recently completed the integration of the Cheddar’s restaurants by transitioning them to DRI’s point of sale system.
Relative value in the long end
While DRI has no investment grade casual dining peers, we continue to like the DRI credit (Baa2/BBB/BBB) relative to McDonald’s Corp. (MCD – Baa1/BBB+/BBB). McDonald’s has been increasing leverage to return cash to shareholders. We estimate that lease adjusted leverage for MCD is currently 3.4x (using a 6.25x lease up), which is over a turn higher than DRI. Even with DRI’s latest acquisition of Cheddar’s, management kept leverage within its target range. We think DRI 4.55% 2/15/48 bonds look attractive relative to MCD 4.45% 3/1/47 as they are currently trading 40 bp wide to MCD. The spread between the two issues, shown in Exhibit 1, has been volatile over time but appears to be recovering. At issue the DRI bonds were trading about 15 bp behind MCD 4.45% 3/1/47. When MCD announced a tap of the 2047 issue in March, bonds traded as close as 5 bp apart and then settled back to roughly 15 bp -20 bp apart. At the wides, the differential was roughly 55 bp – 60 bp apart. DRI credit default swaps trade roughly 15 bp behind MCD.
Exhibit 1: DRI 4.55% 2/15/48 and MCD 4.45% 3/1/47
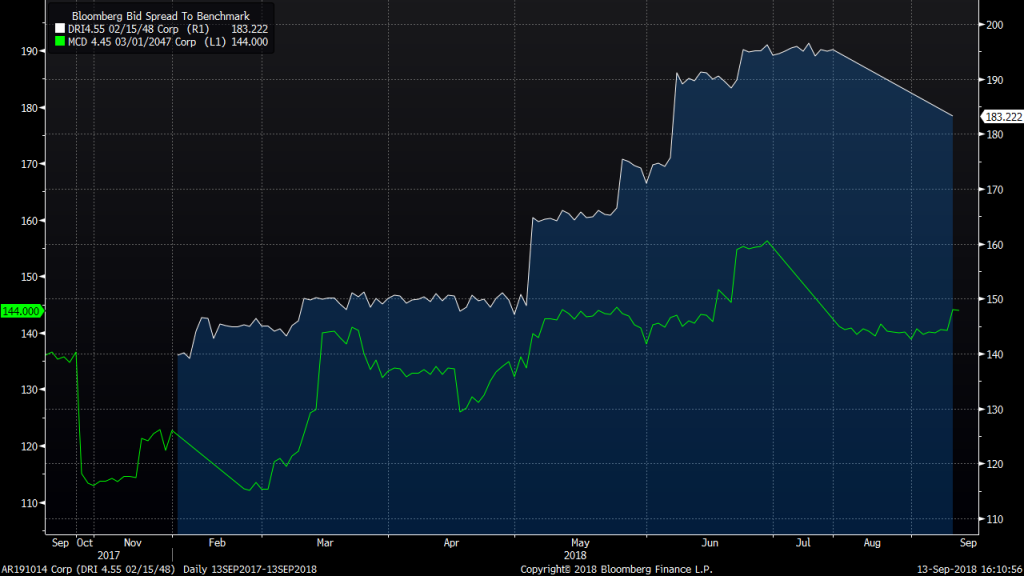
Source: Bloomberg
This material is intended only for institutional investors and does not carry all of the independence and disclosure standards of retail debt research reports. In the preparation of this material, the author may have consulted or otherwise discussed the matters referenced herein with one or more of SCM’s trading desks, any of which may have accumulated or otherwise taken a position, long or short, in any of the financial instruments discussed in or related to this material. Further, SCM may act as a market maker or principal dealer and may have proprietary interests that differ or conflict with the recipient hereof, in connection with any financial instrument discussed in or related to this material.
This message, including any attachments or links contained herein, is subject to important disclaimers, conditions, and disclosures regarding Electronic Communications, which you can find at https://portfolio-strategy.apsec.com/sancap-disclaimers-and-disclosures.
Important Disclaimers
Copyright © 2026 Santander US Capital Markets LLC and its affiliates (“SCM”). All rights reserved. SCM is a member of FINRA and SIPC. This material is intended for limited distribution to institutions only and is not publicly available. Any unauthorized use or disclosure is prohibited.
In making this material available, SCM (i) is not providing any advice to the recipient, including, without limitation, any advice as to investment, legal, accounting, tax and financial matters, (ii) is not acting as an advisor or fiduciary in respect of the recipient, (iii) is not making any predictions or projections and (iv) intends that any recipient to which SCM has provided this material is an “institutional investor” (as defined under applicable law and regulation, including FINRA Rule 4512 and that this material will not be disseminated, in whole or part, to any third party by the recipient.
The author of this material is an economist, desk strategist or trader. In the preparation of this material, the author may have consulted or otherwise discussed the matters referenced herein with one or more of SCM’s trading desks, any of which may have accumulated or otherwise taken a position, long or short, in any of the financial instruments discussed in or related to this material. Further, SCM or any of its affiliates may act as a market maker or principal dealer and may have proprietary interests that differ or conflict with the recipient hereof, in connection with any financial instrument discussed in or related to this material.
This material (i) has been prepared for information purposes only and does not constitute a solicitation or an offer to buy or sell any securities, related investments or other financial instruments, (ii) is neither research, a “research report” as commonly understood under the securities laws and regulations promulgated thereunder nor the product of a research department, (iii) or parts thereof may have been obtained from various sources, the reliability of which has not been verified and cannot be guaranteed by SCM, (iv) should not be reproduced or disclosed to any other person, without SCM’s prior consent and (v) is not intended for distribution in any jurisdiction in which its distribution would be prohibited.
In connection with this material, SCM (i) makes no representation or warranties as to the appropriateness or reliance for use in any transaction or as to the permissibility or legality of any financial instrument in any jurisdiction, (ii) believes the information in this material to be reliable, has not independently verified such information and makes no representation, express or implied, with regard to the accuracy or completeness of such information, (iii) accepts no responsibility or liability as to any reliance placed, or investment decision made, on the basis of such information by the recipient and (iv) does not undertake, and disclaims any duty to undertake, to update or to revise the information contained in this material.
Unless otherwise stated, the views, opinions, forecasts, valuations, or estimates contained in this material are those solely of the author, as of the date of publication of this material, and are subject to change without notice. The recipient of this material should make an independent evaluation of this information and make such other investigations as the recipient considers necessary (including obtaining independent financial advice), before transacting in any financial market or instrument discussed in or related to this material.
Important disclaimers for clients in the EU and UK
This publication has been prepared by Trading Desk Strategists within the Sales and Trading functions of Santander US Capital Markets LLC (“SanCap”), the US registered broker-dealer of Santander Corporate & Investment Banking. This communication is distributed in the EEA by Banco Santander S.A., a credit institution registered in Spain and authorised and regulated by the Bank of Spain and the CNMV. Any EEA recipient of this communication that would like to affect any transaction in any security or issuer discussed herein should do so with Banco Santander S.A. or any of its affiliates (together “Santander”). This communication has been distributed in the UK by Banco Santander, S.A.’s London branch, authorised by the Bank of Spain and subject to regulatory oversight on certain matters by the Financial Conduct Authority (FCA) and the Prudential Regulation Authority (PRA).
The publication is intended for exclusive use for Professional Clients and Eligible Counterparties as defined by MiFID II and is not intended for use by retail customers or for any persons or entities in any jurisdictions or country where such distribution or use would be contrary to local law or regulation.
This material is not a product of Santander´s Research Team and does not constitute independent investment research. This is a marketing communication and may contain ¨investment recommendations¨ as defined by the Market Abuse Regulation 596/2014 ("MAR"). This publication has not been prepared in accordance with legal requirements designed to promote the independence of research and is not subject to any prohibition on dealing ahead of the dissemination of investment research. The author, date and time of the production of this publication are as indicated herein.
This publication does not constitute investment advice and may not be relied upon to form an investment decision, nor should it be construed as any offer to sell or issue or invitation to purchase, acquire or subscribe for any instruments referred herein. The publication has been prepared in good faith and based on information Santander considers reliable as of the date of publication, but Santander does not guarantee or represent, express or implied, that such information is accurate or complete. All estimates, forecasts and opinions are current as at the date of this publication and are subject to change without notice. Unless otherwise indicated, Santander does not intend to update this publication. The views and commentary in this publication may not be objective or independent of the interests of the Trading and Sales functions of Santander, who may be active participants in the markets, investments or strategies referred to herein and/or may receive compensation from investment banking and non-investment banking services from entities mentioned herein. Santander may trade as principal, make a market or hold positions in instruments (or related derivatives) and/or hold financial interest in entities discussed herein. Santander may provide market commentary or trading strategies to other clients or engage in transactions which may differ from views expressed herein. Santander may have acted upon the contents of this publication prior to you having received it.
This publication is intended for the exclusive use of the recipient and must not be reproduced, redistributed or transmitted, in whole or in part, without Santander’s consent. The recipient agrees to keep confidential at all times information contained herein.


