Uncategorized
A post-mortem on repatriation
admin | September 14, 2018
This material is a Marketing Communication and does not constitute Independent Investment Research.
More than $300 billion in offshore corporate cash and fixed income securities came home to the US in the wake of last December’s tax reform. The 15 largest holders then almost immediately sold $66 billion in securities largely to help buy back equity. The estimated $700 billion in remaining corporate holdings still hang over the market. Since corporate cash ultimately should go toward investing in the business, buying back equity or paying dividends, pricing in the markets where corporations traffic looks biased to soften. In the cross-hairs: the Treasury and commercial paper markets and, by extension, LIBOR.
Last December’s tax reform imposed a 1-time tax on existing offshore corporate cash portfolios regardless of whether the corporation brought the cash home or not. Corporations have eight years to pay. Prior US policy had taxed offshore profits whenever a company brought them home, incentive for US corporations to stockpile an estimated $1 trillion in offshore earnings. With no incentive to hold cash offshore any more, companies in the first quarter of this year brought more than $300 billion home – after bringing well under $50 billion home quarterly from most of the last 15 years (Exhibit 1).
Exhibit 1: US corporations in 1Q18 repatriated $300B ($Billions)
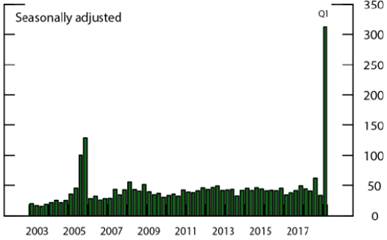
Source: Federal Reserve, US Corporations’ Repatriation of Offshore Profits, FEDS Notes Sep 4, 2018, using the BEA balance of payments data.
The largest holders of corporate cash portfolios apparently went right to work selling. Total securities among the largest 15 cash portfolios dropped in the first quarter by nearly 3% of total corporate assets or $66 billion. It is likely that the sale proceeds helped fund a noticeable spike in equity share buybacks (Exhibit 2).
Exhibit 2: The Top 15 corporate cash portfolios sold securities to buy shares
Ratio: net securities purchases to assets Ratio: share buybacks to assets
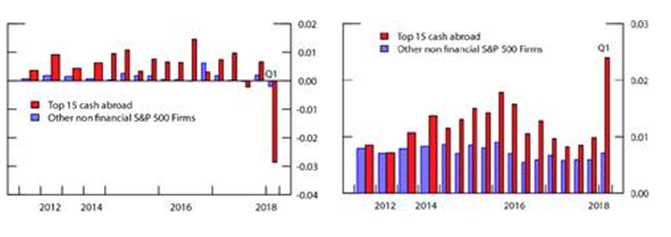
Source: Federal Reserve, US Corporations’ Repatriation of Offshore Profits, FEDS Notes, Sep 4, 2018, using Compustat, Bloomberg.
With an estimated $700 billion in corporate cash still remaining and no clear tax incentive to hang onto the positions, the markets where corporations invest should be nervous. Among the most liquid financial assets held by corporations, savings accounts, money market funds, mutual funds, commercial paper and Treasury and repo agreements make up 94% (Exhibit 3). The money market and mutual funds are likely to have substantial holdings in commercial paper and Treasury bills, so the effective exposure of those markets to corporate asset allocation is likely much larger than the direct holdings. Based on the widening of front-end credit spreads in the first quarter, a disproportionate part of the corporate selling in the first quarter apparently came in commercial paper. Since commercial paper is one of the few active markets that provide a reference for pricing bank credit, LIBOR widened, too.
Exhibit 3: Corporations hold sizable direct and, through funds, indirect positions in Treasury securities and commercial paper.
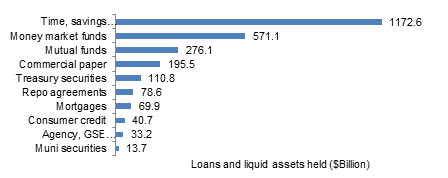
Note: Financial assets of non-financial corporations. Source: Federal Reserve, Financial Accounts of the United States, June 7, 2018, APS.
Commercial paper and other short markets in corporate debt should remain under pressure. Strong but uncertain growth, rising but relatively low interest rates and strong equity markets keep giving corporations incentives to buy back equity. More corporate cash should flow from investment portfolios into equity buybacks, and commercial paper, LIBOR and the markets that reference them should see the effects.
* * *
The view in rates
Rates inched higher and the curve flattened by a couple of basis points in the most recent week. The 10-year Treasury closed the week touching the ceiling of 3.00%. The coming week provides little high impact market data, and we enter the pre-FOMC blackout period for Fed speakers. Look for near-term market drivers from potential tariff-related headline risk and storm damage reports. Weight could possibly be taken off the long end as whatever remaining tax-driven pension fund buying expires over the September 15 corporate tax date. Expect calm and steady trading with rates trickling higher and the curve flatter, before the pace picks up again around the FOMC meeting and into quarter-end.
The view in spreads
Spreads have broadly rolled sideways lately, with investment grade corporate, high yield and emerging markets debt slightly tighter in September and agency MBS slightly wider. Strong US growth might make a bullish case for spreads for now, but longer trends run in the other direction. The Fed is draining liquidity, the risk profile of investment grade credit keeps rising with corporate leverage and even corporate cash repatriation runs to softer spreads. Anecdotal evidence suggests that investors are starting to reallocate away from investment grade credit and into other things. Although agency MBS is likely to do better than credit, the gravitational pull on spreads generally is wider.
The view in credit
A good economy has kept fundamental credit in bounds, but the risk from any softening keeps rising. Leverage has kept rising in investment grade debt, higher LIBOR has kept the pressure on interest rate coverage in leveraged loans and a stronger US dollar has softened prospects for emerging markets. Household balance sheets look strong by comparison. The fundamentals would argue for reallocation from corporate into consumer debt.
This material is intended only for institutional investors and does not carry all of the independence and disclosure standards of retail debt research reports. In the preparation of this material, the author may have consulted or otherwise discussed the matters referenced herein with one or more of SCM’s trading desks, any of which may have accumulated or otherwise taken a position, long or short, in any of the financial instruments discussed in or related to this material. Further, SCM may act as a market maker or principal dealer and may have proprietary interests that differ or conflict with the recipient hereof, in connection with any financial instrument discussed in or related to this material.
This message, including any attachments or links contained herein, is subject to important disclaimers, conditions, and disclosures regarding Electronic Communications, which you can find at https://portfolio-strategy.apsec.com/sancap-disclaimers-and-disclosures.
Important Disclaimers
Copyright © 2026 Santander US Capital Markets LLC and its affiliates (“SCM”). All rights reserved. SCM is a member of FINRA and SIPC. This material is intended for limited distribution to institutions only and is not publicly available. Any unauthorized use or disclosure is prohibited.
In making this material available, SCM (i) is not providing any advice to the recipient, including, without limitation, any advice as to investment, legal, accounting, tax and financial matters, (ii) is not acting as an advisor or fiduciary in respect of the recipient, (iii) is not making any predictions or projections and (iv) intends that any recipient to which SCM has provided this material is an “institutional investor” (as defined under applicable law and regulation, including FINRA Rule 4512 and that this material will not be disseminated, in whole or part, to any third party by the recipient.
The author of this material is an economist, desk strategist or trader. In the preparation of this material, the author may have consulted or otherwise discussed the matters referenced herein with one or more of SCM’s trading desks, any of which may have accumulated or otherwise taken a position, long or short, in any of the financial instruments discussed in or related to this material. Further, SCM or any of its affiliates may act as a market maker or principal dealer and may have proprietary interests that differ or conflict with the recipient hereof, in connection with any financial instrument discussed in or related to this material.
This material (i) has been prepared for information purposes only and does not constitute a solicitation or an offer to buy or sell any securities, related investments or other financial instruments, (ii) is neither research, a “research report” as commonly understood under the securities laws and regulations promulgated thereunder nor the product of a research department, (iii) or parts thereof may have been obtained from various sources, the reliability of which has not been verified and cannot be guaranteed by SCM, (iv) should not be reproduced or disclosed to any other person, without SCM’s prior consent and (v) is not intended for distribution in any jurisdiction in which its distribution would be prohibited.
In connection with this material, SCM (i) makes no representation or warranties as to the appropriateness or reliance for use in any transaction or as to the permissibility or legality of any financial instrument in any jurisdiction, (ii) believes the information in this material to be reliable, has not independently verified such information and makes no representation, express or implied, with regard to the accuracy or completeness of such information, (iii) accepts no responsibility or liability as to any reliance placed, or investment decision made, on the basis of such information by the recipient and (iv) does not undertake, and disclaims any duty to undertake, to update or to revise the information contained in this material.
Unless otherwise stated, the views, opinions, forecasts, valuations, or estimates contained in this material are those solely of the author, as of the date of publication of this material, and are subject to change without notice. The recipient of this material should make an independent evaluation of this information and make such other investigations as the recipient considers necessary (including obtaining independent financial advice), before transacting in any financial market or instrument discussed in or related to this material.
Important disclaimers for clients in the EU and UK
This publication has been prepared by Trading Desk Strategists within the Sales and Trading functions of Santander US Capital Markets LLC (“SanCap”), the US registered broker-dealer of Santander Corporate & Investment Banking. This communication is distributed in the EEA by Banco Santander S.A., a credit institution registered in Spain and authorised and regulated by the Bank of Spain and the CNMV. Any EEA recipient of this communication that would like to affect any transaction in any security or issuer discussed herein should do so with Banco Santander S.A. or any of its affiliates (together “Santander”). This communication has been distributed in the UK by Banco Santander, S.A.’s London branch, authorised by the Bank of Spain and subject to regulatory oversight on certain matters by the Financial Conduct Authority (FCA) and the Prudential Regulation Authority (PRA).
The publication is intended for exclusive use for Professional Clients and Eligible Counterparties as defined by MiFID II and is not intended for use by retail customers or for any persons or entities in any jurisdictions or country where such distribution or use would be contrary to local law or regulation.
This material is not a product of Santander´s Research Team and does not constitute independent investment research. This is a marketing communication and may contain ¨investment recommendations¨ as defined by the Market Abuse Regulation 596/2014 ("MAR"). This publication has not been prepared in accordance with legal requirements designed to promote the independence of research and is not subject to any prohibition on dealing ahead of the dissemination of investment research. The author, date and time of the production of this publication are as indicated herein.
This publication does not constitute investment advice and may not be relied upon to form an investment decision, nor should it be construed as any offer to sell or issue or invitation to purchase, acquire or subscribe for any instruments referred herein. The publication has been prepared in good faith and based on information Santander considers reliable as of the date of publication, but Santander does not guarantee or represent, express or implied, that such information is accurate or complete. All estimates, forecasts and opinions are current as at the date of this publication and are subject to change without notice. Unless otherwise indicated, Santander does not intend to update this publication. The views and commentary in this publication may not be objective or independent of the interests of the Trading and Sales functions of Santander, who may be active participants in the markets, investments or strategies referred to herein and/or may receive compensation from investment banking and non-investment banking services from entities mentioned herein. Santander may trade as principal, make a market or hold positions in instruments (or related derivatives) and/or hold financial interest in entities discussed herein. Santander may provide market commentary or trading strategies to other clients or engage in transactions which may differ from views expressed herein. Santander may have acted upon the contents of this publication prior to you having received it.
This publication is intended for the exclusive use of the recipient and must not be reproduced, redistributed or transmitted, in whole or in part, without Santander’s consent. The recipient agrees to keep confidential at all times information contained herein.


