Uncategorized
The shifting landscape of liquidity
admin | September 7, 2018
This material is a Marketing Communication and does not constitute Independent Investment Research.
Fed policy by design moves liquidity around in the fixed income markets, but the Fed’s exit from QE seems be adding a wrinkle to the process. While Fed policy tends to drain cash and liquidity from the system, the flow of assets from Fed into private hands may be adding liquidity back in some sectors. Agency MBS, among other areas, may be benefitting.
Since the Fed started hiking in December 2015, excess bank reserves at the Fed have dropped $506 billion or 22%. Higher rates have helped drain some cash, but the reversal of QE has been just as powerful if not more. Since the Fed started allowing its portfolio to run off just last September, excess reserves have dropped $305 billion.
Exhibit 1: Fed tightening and the end of QE have driven down excess reserves
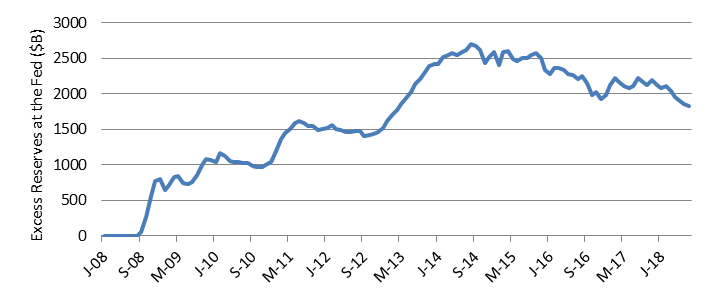
Source: Federal Reserve
Lower cash balances across the financial system should make cash substitutes more valuable, and trading volume in US Treasury bills and corporate commercial paper suggest activity has picked up. Average daily trading volume in T-bills in the months before and after runoff began—in the 11 months before and after October 1, 2017—has run from $91 billion to $108 billion, a 19% jump. Of course, US deficit spending this year and heavy issuance of T-bills has almost surely contributed, too. So, too, could the flow of Treasury debt out of the Fed’s portfolio and into private hands. But total Treasury debt held by the public is up over the same period by only 5%. Average daily trading volume in commercial paper has jumped from $91 billion to $94 billion, a 4% gain, with almost no change in outstanding balances.
Exhibit 2: Shifts in daily trading volume before and after QE exit
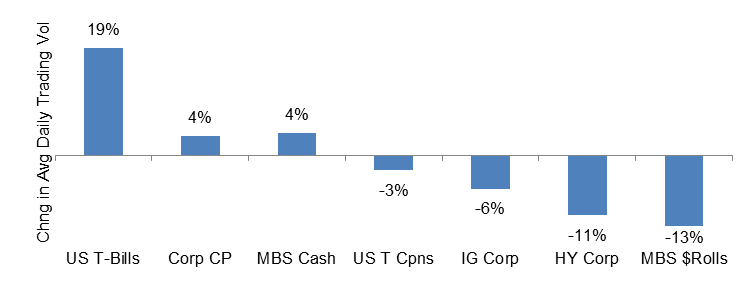
Note: Change in average daily trading volume in the 11 months before and the 11 months after October 1, 2017. Source: Federal Reserve, APS.
The flow of MBS out of the Fed’s portfolio and into private hands also seems to be shaping flows in MBS. Trading in pools is up from $220 billion to $229 billion, a 4% lift. Outstanding agency MBS is also up over the same period by roughly 4%. But volume in MBS dollar rolls is down 13%, possibly reflecting the greater supply of pools for settling TBA trades and consequently the lower likelihood of special financing in that market.
Other major asset categories show a drop in activity. Trading in Treasury notes and bonds has slipped 3%, in investment grade corporate debt by 6% and high yield by 13%. This has come as outstanding balances in investment grade debt over the period have gone up.
The picture painted by changes in trading volume since last September suggest that Fed policy is broadly changing both the level and allocation of liquidity. Assets that substitute for cash or that are passing from Fed to private hands are seeing liquidity pick up while other sectors are seeing liquidity drop. That’s a valuable clue about what lies ahead.
* * *
The view in rates
An above consensus employment number on Friday sparked a 6 bp sell-off, pushing the 10-year Treasury yield back into the mid-2.90s and re-flattening the curve. That’s dead center in the 2.78% – 3.11% range it’s been trading in since February. Next week is heavy with data, and it looms larger with the FOMC’s next rate hike dialed in for later this month. The 10-year should hit 3.00% with a continued modest flattening of the curve on strong economic data. The spoiler could be renewed noise on tariffs or contagion emanating from emerging markets.
The view in spreads
The Fed’s steady draining of liquidity from the markets and a continuing build-up in corporate leverage—the Cigna-Express Scripts deal just the latest example—should keep pressure on spreads. The risk profile of the aggregate investment grade corporate portfolio keeps rising. Spreads should widen as compensation. Agency MBS, meanwhile, may widen slightly in sympathy. But MBS also benefits from liquidity. The relatively flat spread curve from the riskiest to the safest credit should steepen.
The view in credit
Rising leverage poses the clearest risk to fundamental corporate credit while rising interest rates pose the clearest risk to leveraged loans. Since most leveraged loans float off of 1- or 3-month LIBOR, rising rates should keep pressure on interest coverage ratios. Household balance sheets still look relatively strong, although households with student debt continue to find themselves under pressure.
This material is intended only for institutional investors and does not carry all of the independence and disclosure standards of retail debt research reports. In the preparation of this material, the author may have consulted or otherwise discussed the matters referenced herein with one or more of SCM’s trading desks, any of which may have accumulated or otherwise taken a position, long or short, in any of the financial instruments discussed in or related to this material. Further, SCM may act as a market maker or principal dealer and may have proprietary interests that differ or conflict with the recipient hereof, in connection with any financial instrument discussed in or related to this material.
This message, including any attachments or links contained herein, is subject to important disclaimers, conditions, and disclosures regarding Electronic Communications, which you can find at https://portfolio-strategy.apsec.com/sancap-disclaimers-and-disclosures.
Important Disclaimers
Copyright © 2026 Santander US Capital Markets LLC and its affiliates (“SCM”). All rights reserved. SCM is a member of FINRA and SIPC. This material is intended for limited distribution to institutions only and is not publicly available. Any unauthorized use or disclosure is prohibited.
In making this material available, SCM (i) is not providing any advice to the recipient, including, without limitation, any advice as to investment, legal, accounting, tax and financial matters, (ii) is not acting as an advisor or fiduciary in respect of the recipient, (iii) is not making any predictions or projections and (iv) intends that any recipient to which SCM has provided this material is an “institutional investor” (as defined under applicable law and regulation, including FINRA Rule 4512 and that this material will not be disseminated, in whole or part, to any third party by the recipient.
The author of this material is an economist, desk strategist or trader. In the preparation of this material, the author may have consulted or otherwise discussed the matters referenced herein with one or more of SCM’s trading desks, any of which may have accumulated or otherwise taken a position, long or short, in any of the financial instruments discussed in or related to this material. Further, SCM or any of its affiliates may act as a market maker or principal dealer and may have proprietary interests that differ or conflict with the recipient hereof, in connection with any financial instrument discussed in or related to this material.
This material (i) has been prepared for information purposes only and does not constitute a solicitation or an offer to buy or sell any securities, related investments or other financial instruments, (ii) is neither research, a “research report” as commonly understood under the securities laws and regulations promulgated thereunder nor the product of a research department, (iii) or parts thereof may have been obtained from various sources, the reliability of which has not been verified and cannot be guaranteed by SCM, (iv) should not be reproduced or disclosed to any other person, without SCM’s prior consent and (v) is not intended for distribution in any jurisdiction in which its distribution would be prohibited.
In connection with this material, SCM (i) makes no representation or warranties as to the appropriateness or reliance for use in any transaction or as to the permissibility or legality of any financial instrument in any jurisdiction, (ii) believes the information in this material to be reliable, has not independently verified such information and makes no representation, express or implied, with regard to the accuracy or completeness of such information, (iii) accepts no responsibility or liability as to any reliance placed, or investment decision made, on the basis of such information by the recipient and (iv) does not undertake, and disclaims any duty to undertake, to update or to revise the information contained in this material.
Unless otherwise stated, the views, opinions, forecasts, valuations, or estimates contained in this material are those solely of the author, as of the date of publication of this material, and are subject to change without notice. The recipient of this material should make an independent evaluation of this information and make such other investigations as the recipient considers necessary (including obtaining independent financial advice), before transacting in any financial market or instrument discussed in or related to this material.
Important disclaimers for clients in the EU and UK
This publication has been prepared by Trading Desk Strategists within the Sales and Trading functions of Santander US Capital Markets LLC (“SanCap”), the US registered broker-dealer of Santander Corporate & Investment Banking. This communication is distributed in the EEA by Banco Santander S.A., a credit institution registered in Spain and authorised and regulated by the Bank of Spain and the CNMV. Any EEA recipient of this communication that would like to affect any transaction in any security or issuer discussed herein should do so with Banco Santander S.A. or any of its affiliates (together “Santander”). This communication has been distributed in the UK by Banco Santander, S.A.’s London branch, authorised by the Bank of Spain and subject to regulatory oversight on certain matters by the Financial Conduct Authority (FCA) and the Prudential Regulation Authority (PRA).
The publication is intended for exclusive use for Professional Clients and Eligible Counterparties as defined by MiFID II and is not intended for use by retail customers or for any persons or entities in any jurisdictions or country where such distribution or use would be contrary to local law or regulation.
This material is not a product of Santander´s Research Team and does not constitute independent investment research. This is a marketing communication and may contain ¨investment recommendations¨ as defined by the Market Abuse Regulation 596/2014 ("MAR"). This publication has not been prepared in accordance with legal requirements designed to promote the independence of research and is not subject to any prohibition on dealing ahead of the dissemination of investment research. The author, date and time of the production of this publication are as indicated herein.
This publication does not constitute investment advice and may not be relied upon to form an investment decision, nor should it be construed as any offer to sell or issue or invitation to purchase, acquire or subscribe for any instruments referred herein. The publication has been prepared in good faith and based on information Santander considers reliable as of the date of publication, but Santander does not guarantee or represent, express or implied, that such information is accurate or complete. All estimates, forecasts and opinions are current as at the date of this publication and are subject to change without notice. Unless otherwise indicated, Santander does not intend to update this publication. The views and commentary in this publication may not be objective or independent of the interests of the Trading and Sales functions of Santander, who may be active participants in the markets, investments or strategies referred to herein and/or may receive compensation from investment banking and non-investment banking services from entities mentioned herein. Santander may trade as principal, make a market or hold positions in instruments (or related derivatives) and/or hold financial interest in entities discussed herein. Santander may provide market commentary or trading strategies to other clients or engage in transactions which may differ from views expressed herein. Santander may have acted upon the contents of this publication prior to you having received it.
This publication is intended for the exclusive use of the recipient and must not be reproduced, redistributed or transmitted, in whole or in part, without Santander’s consent. The recipient agrees to keep confidential at all times information contained herein.


