Uncategorized
Step-dancing through legacy MBS
admin | September 7, 2018
This material is a Marketing Communication and does not constitute Independent Investment Research.
Servicers of legacy mortgage loans with modified interest rates have started to show meaningful differences in the pace at which rates step up. Since the higher rates generate more cash flow for legacy MBS and reduce interest rate risk, differences across servicers matter. The average age of the modified loans turns out to be a valuable rule of thumb. By that measure, Ocwen flashes a warning sign.
Sparse data on modifications
Identifying modified loans with potential for the interest rate to step up continues to be a challenge. Many servicers followed HAMP guidelines or close approximations, first lowering rates for troubled borrowers then extending term and finally allowing principal forbearance. But many servicers did not. Unknown modification terms and sparse data from servicers and trustees make the search difficult. Modified rates usually step up to some market level. But the rates may step up after different periods, in different increments and to different final rates. There is risk and opportunity.
Looking at the universe of rate modified re-performing loans, roughly one-third of them have experienced a rate increase as of the August remittance cycle. However that number varies across major servicers. SPS had only 17% of rate modifications that have stepped- approximately half the universe average–while Chase/EMC, Nationstar and Citi all have had more than 40% of their rate modifications step up.
Exhibit 1: Step ups vary significantly by servicer
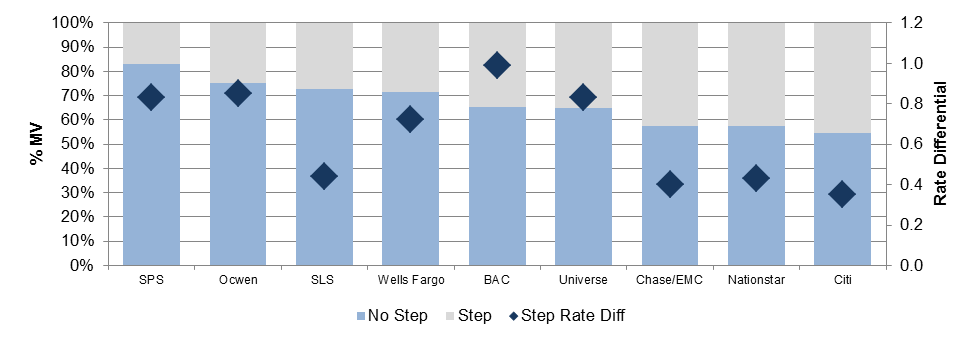
Source: Amherst Insight Labs, Amherst Pierpont
This disparity begs the question whether a large population of modified loans sits in the wings with rates about to step up, generating more cash flow for investors and reducing the risk that the floating-rate securities come up against an available funds cap.
The average months since modification for loans that have not yet stepped up turns out to be an important clue. There is a fairly wide distribution in average months since modification across servicers ranging from three years to just over five years. A pool that has an average of more than five years post-modification may have a lower population of loans that could step up than a pool with less seasoning post-modification, assuming typical HAMP or HAMP-like modification terms. This first thing we notice when looking at the distribution of age since modification is that SLS has both the lowest percentage of loans that have stepped up (83%) but also the lowest average months since modification (36 months), suggesting that there may be significant upside to these loans stepping up but that upside may not be realized for two years or more.
Exhibit 2: Average months since modification vary by servicer
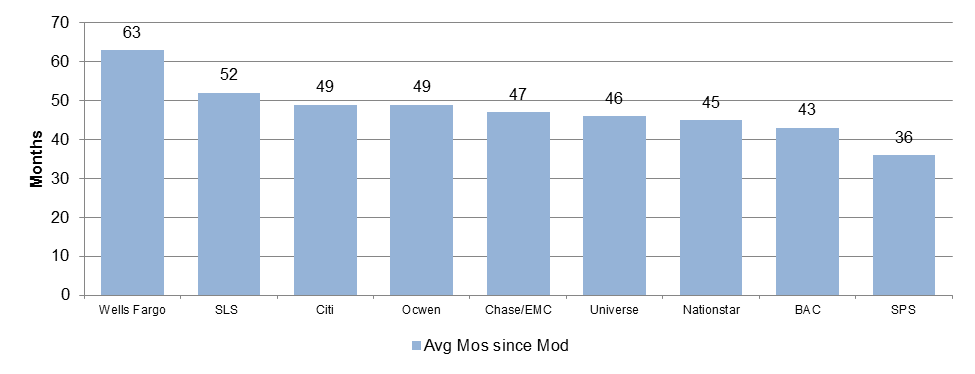
Source: Amherst Insight Labs, Amherst Pierpont
But averages are just that, averages. The distribution of rate modified RPLs that have not stepped up is even more telling. The legacy universe, Nationstar, who has seen nearly half their rate modified RPLs step up and Ocwen, who has a large percentage of RPLs that have yet to step offer good examples.
The universe has an average of 46 months since modification. Looking at the distribution of those loans, 72.2% are less than 60 months post modification while 27.8% are more than 60 months post-mod, suggesting roughly three quarters of RPLs that haven’t stepped have a good chance of seeing a rate increase. The Nationstar numbers look quite similar with 76.7% of loans that have not seen a rate change are less than 60 months since modification.
Ocwen looks materially different. Approximately 50% of modified Ocwen RPLs have seasoned more than 60 months. Admittedly, the biggest concentration of loans is between five and six years post-modification and could still step up in the near future. Additionally, there is a conspicuous absence of loans that haven’t stepped in the seven- and eight-year post mod buckets, suggesting that loans that seasoned post-modification have stepped. However, in all likelihood the longer these loans season past six years without seeing a rate change, the less likely a rate change might occur. If these loans are in actuality fixed rate modifications, there are meaningful implications for both current valuations and rate durations for bonds backed by Ocwen serviced, seasoned RPLs. Especially those at the bottom of the capital structure that are levered to excess spread as rates and liability yields rise while asset WACs are stuck at lower fixed rates.
Exhibit 3: Distribution of non-stepped RPLs by age and servicer
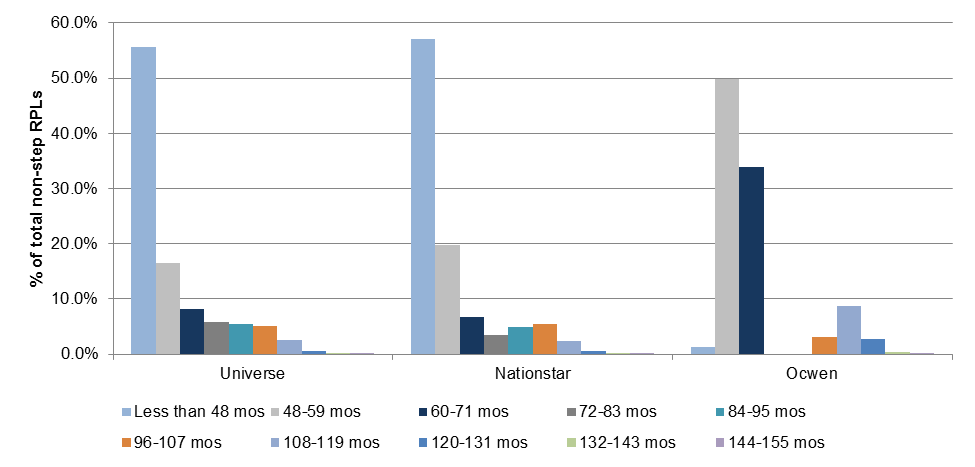
Source: Amherst Insight Labs, Amherst Pierpont
This material is intended only for institutional investors and does not carry all of the independence and disclosure standards of retail debt research reports. In the preparation of this material, the author may have consulted or otherwise discussed the matters referenced herein with one or more of SCM’s trading desks, any of which may have accumulated or otherwise taken a position, long or short, in any of the financial instruments discussed in or related to this material. Further, SCM may act as a market maker or principal dealer and may have proprietary interests that differ or conflict with the recipient hereof, in connection with any financial instrument discussed in or related to this material.
This message, including any attachments or links contained herein, is subject to important disclaimers, conditions, and disclosures regarding Electronic Communications, which you can find at https://portfolio-strategy.apsec.com/sancap-disclaimers-and-disclosures.
Important Disclaimers
Copyright © 2026 Santander US Capital Markets LLC and its affiliates (“SCM”). All rights reserved. SCM is a member of FINRA and SIPC. This material is intended for limited distribution to institutions only and is not publicly available. Any unauthorized use or disclosure is prohibited.
In making this material available, SCM (i) is not providing any advice to the recipient, including, without limitation, any advice as to investment, legal, accounting, tax and financial matters, (ii) is not acting as an advisor or fiduciary in respect of the recipient, (iii) is not making any predictions or projections and (iv) intends that any recipient to which SCM has provided this material is an “institutional investor” (as defined under applicable law and regulation, including FINRA Rule 4512 and that this material will not be disseminated, in whole or part, to any third party by the recipient.
The author of this material is an economist, desk strategist or trader. In the preparation of this material, the author may have consulted or otherwise discussed the matters referenced herein with one or more of SCM’s trading desks, any of which may have accumulated or otherwise taken a position, long or short, in any of the financial instruments discussed in or related to this material. Further, SCM or any of its affiliates may act as a market maker or principal dealer and may have proprietary interests that differ or conflict with the recipient hereof, in connection with any financial instrument discussed in or related to this material.
This material (i) has been prepared for information purposes only and does not constitute a solicitation or an offer to buy or sell any securities, related investments or other financial instruments, (ii) is neither research, a “research report” as commonly understood under the securities laws and regulations promulgated thereunder nor the product of a research department, (iii) or parts thereof may have been obtained from various sources, the reliability of which has not been verified and cannot be guaranteed by SCM, (iv) should not be reproduced or disclosed to any other person, without SCM’s prior consent and (v) is not intended for distribution in any jurisdiction in which its distribution would be prohibited.
In connection with this material, SCM (i) makes no representation or warranties as to the appropriateness or reliance for use in any transaction or as to the permissibility or legality of any financial instrument in any jurisdiction, (ii) believes the information in this material to be reliable, has not independently verified such information and makes no representation, express or implied, with regard to the accuracy or completeness of such information, (iii) accepts no responsibility or liability as to any reliance placed, or investment decision made, on the basis of such information by the recipient and (iv) does not undertake, and disclaims any duty to undertake, to update or to revise the information contained in this material.
Unless otherwise stated, the views, opinions, forecasts, valuations, or estimates contained in this material are those solely of the author, as of the date of publication of this material, and are subject to change without notice. The recipient of this material should make an independent evaluation of this information and make such other investigations as the recipient considers necessary (including obtaining independent financial advice), before transacting in any financial market or instrument discussed in or related to this material.
Important disclaimers for clients in the EU and UK
This publication has been prepared by Trading Desk Strategists within the Sales and Trading functions of Santander US Capital Markets LLC (“SanCap”), the US registered broker-dealer of Santander Corporate & Investment Banking. This communication is distributed in the EEA by Banco Santander S.A., a credit institution registered in Spain and authorised and regulated by the Bank of Spain and the CNMV. Any EEA recipient of this communication that would like to affect any transaction in any security or issuer discussed herein should do so with Banco Santander S.A. or any of its affiliates (together “Santander”). This communication has been distributed in the UK by Banco Santander, S.A.’s London branch, authorised by the Bank of Spain and subject to regulatory oversight on certain matters by the Financial Conduct Authority (FCA) and the Prudential Regulation Authority (PRA).
The publication is intended for exclusive use for Professional Clients and Eligible Counterparties as defined by MiFID II and is not intended for use by retail customers or for any persons or entities in any jurisdictions or country where such distribution or use would be contrary to local law or regulation.
This material is not a product of Santander´s Research Team and does not constitute independent investment research. This is a marketing communication and may contain ¨investment recommendations¨ as defined by the Market Abuse Regulation 596/2014 ("MAR"). This publication has not been prepared in accordance with legal requirements designed to promote the independence of research and is not subject to any prohibition on dealing ahead of the dissemination of investment research. The author, date and time of the production of this publication are as indicated herein.
This publication does not constitute investment advice and may not be relied upon to form an investment decision, nor should it be construed as any offer to sell or issue or invitation to purchase, acquire or subscribe for any instruments referred herein. The publication has been prepared in good faith and based on information Santander considers reliable as of the date of publication, but Santander does not guarantee or represent, express or implied, that such information is accurate or complete. All estimates, forecasts and opinions are current as at the date of this publication and are subject to change without notice. Unless otherwise indicated, Santander does not intend to update this publication. The views and commentary in this publication may not be objective or independent of the interests of the Trading and Sales functions of Santander, who may be active participants in the markets, investments or strategies referred to herein and/or may receive compensation from investment banking and non-investment banking services from entities mentioned herein. Santander may trade as principal, make a market or hold positions in instruments (or related derivatives) and/or hold financial interest in entities discussed herein. Santander may provide market commentary or trading strategies to other clients or engage in transactions which may differ from views expressed herein. Santander may have acted upon the contents of this publication prior to you having received it.
This publication is intended for the exclusive use of the recipient and must not be reproduced, redistributed or transmitted, in whole or in part, without Santander’s consent. The recipient agrees to keep confidential at all times information contained herein.


