Uncategorized
A few more reasons to like New York
admin | September 7, 2018
This material is a Marketing Communication and does not constitute Independent Investment Research.
Pass-throughs near par backed by loans from New York offer some of the better current value among agency MBS specified pools. These pools price from 5% to 50% of theoretical value since they offer clear call protection in a market arguably more focused on extension. Local mortgage recording taxes help create the convexity. Add that to the list of things to like about New York.
New York pools have slow, flat S-Curves
New York loans have historically exhibited very slow prepayment speeds and continue to be a good source of call protection. New York state charges a large tax on new mortgages that borrowers must pay at closing, which means that a New York borrower will have less incentive to refinance than a borrower in a similar loan from another state. This collateral looks especially attractive at near-par coupons (3.5%s and 4.0%s)—the market prices these loans well below theoretical value since these pools underperform in higher interest rate scenarios. These pools could be a source of inexpensive call protection for investors with a strong view that rates will go lower.
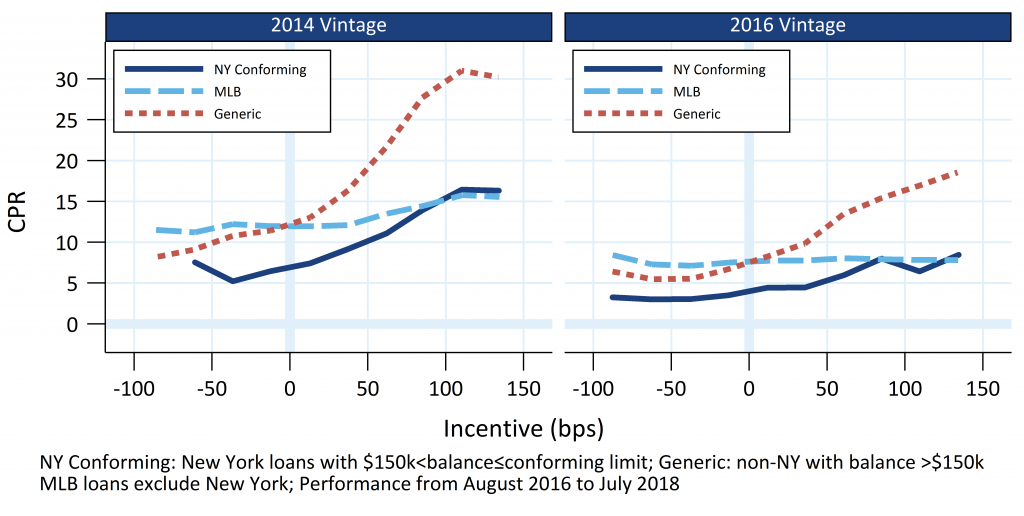
Exhibit 1 (below) compares prepayment speeds for New York loans with balances greater than $150,000 and less than the conforming limit to non-New York loans with the same range of balances. It also includes a comparison to MLB collateral—pools with a maximum loan size of $110,000.
Exhibit 1: NY, Generic and MLB S-Curves, last 24 months
Source: Fannie Mae, Freddie Mac, eMBS, 1010data, Amherst Pierpont Securities
The market has understood for a long time that New York loans prepay slowly; the past two years’ performance was chosen to demonstrate that this hasn’t recently changed. A concern was that the 2018 cap on the federal tax deduction of state and local taxes (“SALT”) would fuel an exodus out of New York. However, this isn’t visible in the data, and most people find it difficult to make major life changes to avoid a tax increase. The 2014 and 2016 vintages were chosen to show that the speed difference exists for newer and more seasoned loans.
New York loans prepay comparably to MLB loans from other states at the fastest part of the S-curve, but at lower rate incentives New York loans prepay much slower than the MLB loans. Therefore New York loans provide substantial call protection, but underperform in a discount environment since they extend more than generic and loan balance collateral.
New York’s mortgage recording tax slows prepayment speeds
Prepayment speeds are slow in New York due to the state’s “mortgage recording tax” for new mortgages. This tax is very high and varies, by locality, from 75 bp to 212.5 bp. Using a 5× IO multiple implies that a New York borrower is 15–42.5 bp further out-of-the-money than a borrower with the same note rate in most other states. Furthermore, the mortgage process in New York is more costly and has higher frictions due to other factors. For example, most New York loans require lawyer(s) to be involved with the closing process, but this is not necessary in most other states.
The empirical data shows that New York loans are slow to refinance despite a mechanism to avoid paying the recording tax on a refinance. This is known as a “CEMA” (Consolidation, Extension, or Modification Agreement)—it modifies the terms of the original mortgage instead of recording a new mortgage. However, borrowers have to pay additional fees to execute the CEMA, which offsets some of the tax savings. Also, the existing lender has to agree to do the CEMA, which means they can refuse to if the borrower is using a different lender for the new loan. This gives the lender leverage to charge an above-market rate to those borrowers.
The recording tax cannot be avoided on a purchase transaction, except in the case of a co-op property.
New York pay-ups look low on lower coupons
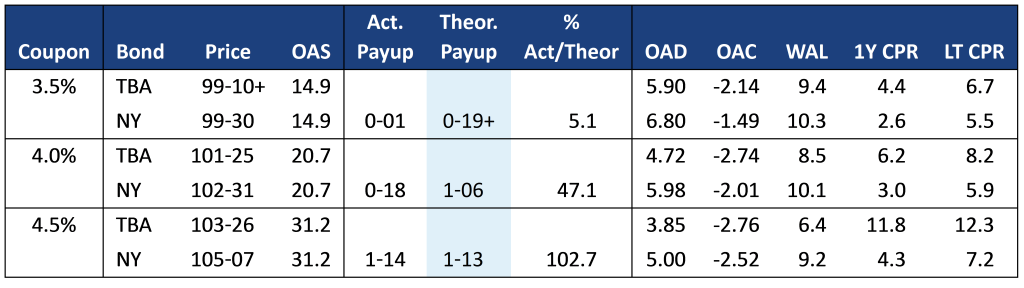
Exhibit 2 (below) shows YieldBook’s theoretical pay-ups on three 2018 vintage 100% New York pools.
Exhibit 2: Payups are cheap to theoretical value (as of 9/6/2018)
Source: YieldBook, Amherst Pierpont Securities
Lower coupon New York pools could be an inexpensive source of call protection for investors with a strong view that rates will move lower. The model thinks market pay-ups are very low on 3.5%s and relatively low on 4.0%s—5.1% and 47.1% of theoretical value, respectively. The market does not offer much pay-up at lower coupons since these loans don’t perform well in higher interest rate environments, but it appears that market pricing is too punitive. 4.5%s, however, appear to be fully priced at 102.7% of theoretical value.
It almost goes without saying that investors can magnify the value of New York pools through IO, inverse IO and other mortgage structures.
This material is intended only for institutional investors and does not carry all of the independence and disclosure standards of retail debt research reports. In the preparation of this material, the author may have consulted or otherwise discussed the matters referenced herein with one or more of SCM’s trading desks, any of which may have accumulated or otherwise taken a position, long or short, in any of the financial instruments discussed in or related to this material. Further, SCM may act as a market maker or principal dealer and may have proprietary interests that differ or conflict with the recipient hereof, in connection with any financial instrument discussed in or related to this material.
This message, including any attachments or links contained herein, is subject to important disclaimers, conditions, and disclosures regarding Electronic Communications, which you can find at https://portfolio-strategy.apsec.com/sancap-disclaimers-and-disclosures.
Important Disclaimers
Copyright © 2026 Santander US Capital Markets LLC and its affiliates (“SCM”). All rights reserved. SCM is a member of FINRA and SIPC. This material is intended for limited distribution to institutions only and is not publicly available. Any unauthorized use or disclosure is prohibited.
In making this material available, SCM (i) is not providing any advice to the recipient, including, without limitation, any advice as to investment, legal, accounting, tax and financial matters, (ii) is not acting as an advisor or fiduciary in respect of the recipient, (iii) is not making any predictions or projections and (iv) intends that any recipient to which SCM has provided this material is an “institutional investor” (as defined under applicable law and regulation, including FINRA Rule 4512 and that this material will not be disseminated, in whole or part, to any third party by the recipient.
The author of this material is an economist, desk strategist or trader. In the preparation of this material, the author may have consulted or otherwise discussed the matters referenced herein with one or more of SCM’s trading desks, any of which may have accumulated or otherwise taken a position, long or short, in any of the financial instruments discussed in or related to this material. Further, SCM or any of its affiliates may act as a market maker or principal dealer and may have proprietary interests that differ or conflict with the recipient hereof, in connection with any financial instrument discussed in or related to this material.
This material (i) has been prepared for information purposes only and does not constitute a solicitation or an offer to buy or sell any securities, related investments or other financial instruments, (ii) is neither research, a “research report” as commonly understood under the securities laws and regulations promulgated thereunder nor the product of a research department, (iii) or parts thereof may have been obtained from various sources, the reliability of which has not been verified and cannot be guaranteed by SCM, (iv) should not be reproduced or disclosed to any other person, without SCM’s prior consent and (v) is not intended for distribution in any jurisdiction in which its distribution would be prohibited.
In connection with this material, SCM (i) makes no representation or warranties as to the appropriateness or reliance for use in any transaction or as to the permissibility or legality of any financial instrument in any jurisdiction, (ii) believes the information in this material to be reliable, has not independently verified such information and makes no representation, express or implied, with regard to the accuracy or completeness of such information, (iii) accepts no responsibility or liability as to any reliance placed, or investment decision made, on the basis of such information by the recipient and (iv) does not undertake, and disclaims any duty to undertake, to update or to revise the information contained in this material.
Unless otherwise stated, the views, opinions, forecasts, valuations, or estimates contained in this material are those solely of the author, as of the date of publication of this material, and are subject to change without notice. The recipient of this material should make an independent evaluation of this information and make such other investigations as the recipient considers necessary (including obtaining independent financial advice), before transacting in any financial market or instrument discussed in or related to this material.
Important disclaimers for clients in the EU and UK
This publication has been prepared by Trading Desk Strategists within the Sales and Trading functions of Santander US Capital Markets LLC (“SanCap”), the US registered broker-dealer of Santander Corporate & Investment Banking. This communication is distributed in the EEA by Banco Santander S.A., a credit institution registered in Spain and authorised and regulated by the Bank of Spain and the CNMV. Any EEA recipient of this communication that would like to affect any transaction in any security or issuer discussed herein should do so with Banco Santander S.A. or any of its affiliates (together “Santander”). This communication has been distributed in the UK by Banco Santander, S.A.’s London branch, authorised by the Bank of Spain and subject to regulatory oversight on certain matters by the Financial Conduct Authority (FCA) and the Prudential Regulation Authority (PRA).
The publication is intended for exclusive use for Professional Clients and Eligible Counterparties as defined by MiFID II and is not intended for use by retail customers or for any persons or entities in any jurisdictions or country where such distribution or use would be contrary to local law or regulation.
This material is not a product of Santander´s Research Team and does not constitute independent investment research. This is a marketing communication and may contain ¨investment recommendations¨ as defined by the Market Abuse Regulation 596/2014 ("MAR"). This publication has not been prepared in accordance with legal requirements designed to promote the independence of research and is not subject to any prohibition on dealing ahead of the dissemination of investment research. The author, date and time of the production of this publication are as indicated herein.
This publication does not constitute investment advice and may not be relied upon to form an investment decision, nor should it be construed as any offer to sell or issue or invitation to purchase, acquire or subscribe for any instruments referred herein. The publication has been prepared in good faith and based on information Santander considers reliable as of the date of publication, but Santander does not guarantee or represent, express or implied, that such information is accurate or complete. All estimates, forecasts and opinions are current as at the date of this publication and are subject to change without notice. Unless otherwise indicated, Santander does not intend to update this publication. The views and commentary in this publication may not be objective or independent of the interests of the Trading and Sales functions of Santander, who may be active participants in the markets, investments or strategies referred to herein and/or may receive compensation from investment banking and non-investment banking services from entities mentioned herein. Santander may trade as principal, make a market or hold positions in instruments (or related derivatives) and/or hold financial interest in entities discussed herein. Santander may provide market commentary or trading strategies to other clients or engage in transactions which may differ from views expressed herein. Santander may have acted upon the contents of this publication prior to you having received it.
This publication is intended for the exclusive use of the recipient and must not be reproduced, redistributed or transmitted, in whole or in part, without Santander’s consent. The recipient agrees to keep confidential at all times information contained herein.


