Uncategorized
MBS: Inexpensive extension protection in MHA pools
admin | August 17, 2018
This material is a Marketing Communication and does not constitute Independent Investment Research.
Making Home Affordable or MHA pools promise some inexpensive extension protection as home price appreciation and amortization have lowered mark-to-market LTVs below 80%. These borrowers were initially constrained from prepaying due to home price depreciation during the housing crisis, which suppressed housing turnover below its normal level. Subsequent appreciation has unlocked this pent-up turnover and pushed speeds faster than the cohort, which is already prepaying faster than TBA pools. Faster speeds should lift performance in pools trading below par.
Discount MHA pools have prepaid faster since early 2017
Since early 2017, discount pools of all four MHA categories—loans with maximum original LTVs of 90, 95, 100, and 105—have prepaid faster than generic pools of the same vintage (Exhibit 1). The bulk of discount production was in 3.0% and 3.5% pools issued in 2012 and 2013; primary mortgage rates had reached some of their lowest levels of the last 20 years, and production declined substantially after 2013.
Exhibit 1: Prepayment speeds, January 2017 through July 2018
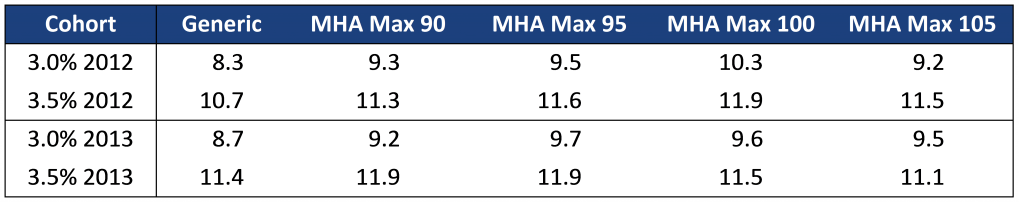
Source: Fannie Mae, Freddie Mac eMBS, 1010data, Amherst Pierpont Securities
On average, 2012 MHA pools are prepaying roughly 1.0 CPR faster than generic pools, while the 2013 MHA pools are generally 0.5–1.0 CPR faster than generic. While the 2013 MHA pools prepay slightly closer to generic than the 2012 pools, the gap should widen over the next year as the 2013 pools season and LTVs drop even lower.
Home price appreciation removes a barrier to moving
Many of these mortgages have mark-to-market LTVs less than 80% during 2017 and 2018, which has removed a barrier to prepaying the loan. Even the highest LTV loans had dropped below 80% LTV prior to 2017 (Exhibit 2). This likely unlocked the ability of these borrowers to move more easily—for example, a borrower can re-lever to 80% LTV and buy a larger home—and the possibility that housing turnover would match or exceed the levels of generic pools.
Exhibit 2: Date each cohort dropped below 80 LTV
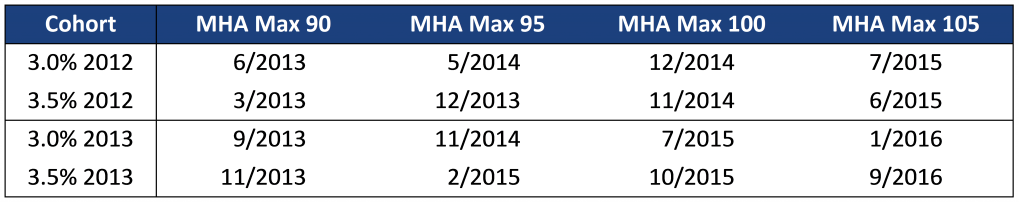 Source: Fannie Mae, Freddie Mac, eMBS, CaseShiller, 1010data, Amherst Pierpont Securities
The 2013 vintage MHA pools are prepaying closer to generic pools than the 2012 vintage since they have less seasoning and accumulated HPA. This is particularly true of the 3.5%s 2013, which were originated later in 2013. However, over the next year the differential should widen to the 1.0 CPR exhibited by the 2012 vintage due to further home price appreciation.
MHA pools are less sensitive to cash out refinance rates
MHA pools should outperform generic pools if mortgage rates move higher, since discount MHA prepayments are less levered to cash out refinance rates. MHA pools have higher LTVs than generic pools, so fewer borrowers can do a cash out refinance. As rates move higher, some borrowers should forgo a cashout refinance if it is not economic, but fewer borrowers should avoid moving for the same reason. This should slow generic pool speeds more than MHA speeds, and is an additional source of extension protection in MHA pools.
MHA looks undervalued
These loans currently trade at roughly 20/32s to 28/32s over TBA. Payups are somewhat higher for 2012s over 2013s, and for 3.5%s over 3.0%s. Payups are roughly 40% to 45% of theoretical value for 3.0%s and 50% to 55% for 3.5%s (Exhibit 3). The payup is calculated by running the MHA bonds at the same OAS as each coupon’s TBA; the MHA bonds are run by dialing Yield Book to achieve 1.0 CPR faster discount speeds than the respective cohort.
Exhibit 3: Payups come in below theoretical values (as of 8/15/2018)
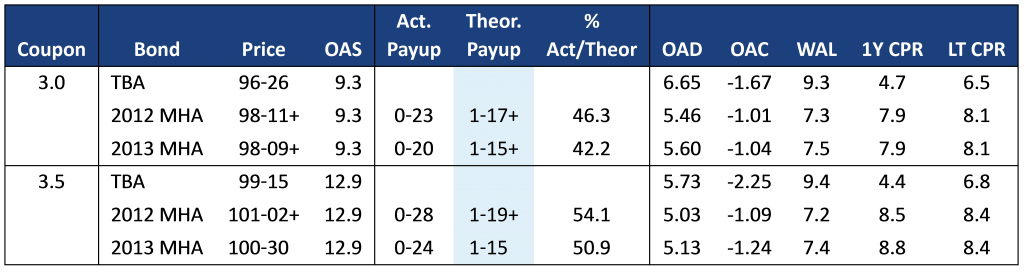
Note: All market levels as of 8/15/18. Source: YieldBook, APS
The theoretical value assumes that MHA pools will prepay 1.0 CPR faster in a sell-off, but this gap might widen into higher rates. This means the theoretical values should probably be even higher. All four MHA bonds are shorter duration and better convexity than the respective TBA. Hedged with roughly 85% of the TBA, the trade is positive carry.
This material is intended only for institutional investors and does not carry all of the independence and disclosure standards of retail debt research reports. In the preparation of this material, the author may have consulted or otherwise discussed the matters referenced herein with one or more of SCM’s trading desks, any of which may have accumulated or otherwise taken a position, long or short, in any of the financial instruments discussed in or related to this material. Further, SCM may act as a market maker or principal dealer and may have proprietary interests that differ or conflict with the recipient hereof, in connection with any financial instrument discussed in or related to this material.
This message, including any attachments or links contained herein, is subject to important disclaimers, conditions, and disclosures regarding Electronic Communications, which you can find at https://portfolio-strategy.apsec.com/sancap-disclaimers-and-disclosures.
Important Disclaimers
Copyright © 2026 Santander US Capital Markets LLC and its affiliates (“SCM”). All rights reserved. SCM is a member of FINRA and SIPC. This material is intended for limited distribution to institutions only and is not publicly available. Any unauthorized use or disclosure is prohibited.
In making this material available, SCM (i) is not providing any advice to the recipient, including, without limitation, any advice as to investment, legal, accounting, tax and financial matters, (ii) is not acting as an advisor or fiduciary in respect of the recipient, (iii) is not making any predictions or projections and (iv) intends that any recipient to which SCM has provided this material is an “institutional investor” (as defined under applicable law and regulation, including FINRA Rule 4512 and that this material will not be disseminated, in whole or part, to any third party by the recipient.
The author of this material is an economist, desk strategist or trader. In the preparation of this material, the author may have consulted or otherwise discussed the matters referenced herein with one or more of SCM’s trading desks, any of which may have accumulated or otherwise taken a position, long or short, in any of the financial instruments discussed in or related to this material. Further, SCM or any of its affiliates may act as a market maker or principal dealer and may have proprietary interests that differ or conflict with the recipient hereof, in connection with any financial instrument discussed in or related to this material.
This material (i) has been prepared for information purposes only and does not constitute a solicitation or an offer to buy or sell any securities, related investments or other financial instruments, (ii) is neither research, a “research report” as commonly understood under the securities laws and regulations promulgated thereunder nor the product of a research department, (iii) or parts thereof may have been obtained from various sources, the reliability of which has not been verified and cannot be guaranteed by SCM, (iv) should not be reproduced or disclosed to any other person, without SCM’s prior consent and (v) is not intended for distribution in any jurisdiction in which its distribution would be prohibited.
In connection with this material, SCM (i) makes no representation or warranties as to the appropriateness or reliance for use in any transaction or as to the permissibility or legality of any financial instrument in any jurisdiction, (ii) believes the information in this material to be reliable, has not independently verified such information and makes no representation, express or implied, with regard to the accuracy or completeness of such information, (iii) accepts no responsibility or liability as to any reliance placed, or investment decision made, on the basis of such information by the recipient and (iv) does not undertake, and disclaims any duty to undertake, to update or to revise the information contained in this material.
Unless otherwise stated, the views, opinions, forecasts, valuations, or estimates contained in this material are those solely of the author, as of the date of publication of this material, and are subject to change without notice. The recipient of this material should make an independent evaluation of this information and make such other investigations as the recipient considers necessary (including obtaining independent financial advice), before transacting in any financial market or instrument discussed in or related to this material.
Important disclaimers for clients in the EU and UK
This publication has been prepared by Trading Desk Strategists within the Sales and Trading functions of Santander US Capital Markets LLC (“SanCap”), the US registered broker-dealer of Santander Corporate & Investment Banking. This communication is distributed in the EEA by Banco Santander S.A., a credit institution registered in Spain and authorised and regulated by the Bank of Spain and the CNMV. Any EEA recipient of this communication that would like to affect any transaction in any security or issuer discussed herein should do so with Banco Santander S.A. or any of its affiliates (together “Santander”). This communication has been distributed in the UK by Banco Santander, S.A.’s London branch, authorised by the Bank of Spain and subject to regulatory oversight on certain matters by the Financial Conduct Authority (FCA) and the Prudential Regulation Authority (PRA).
The publication is intended for exclusive use for Professional Clients and Eligible Counterparties as defined by MiFID II and is not intended for use by retail customers or for any persons or entities in any jurisdictions or country where such distribution or use would be contrary to local law or regulation.
This material is not a product of Santander´s Research Team and does not constitute independent investment research. This is a marketing communication and may contain ¨investment recommendations¨ as defined by the Market Abuse Regulation 596/2014 ("MAR"). This publication has not been prepared in accordance with legal requirements designed to promote the independence of research and is not subject to any prohibition on dealing ahead of the dissemination of investment research. The author, date and time of the production of this publication are as indicated herein.
This publication does not constitute investment advice and may not be relied upon to form an investment decision, nor should it be construed as any offer to sell or issue or invitation to purchase, acquire or subscribe for any instruments referred herein. The publication has been prepared in good faith and based on information Santander considers reliable as of the date of publication, but Santander does not guarantee or represent, express or implied, that such information is accurate or complete. All estimates, forecasts and opinions are current as at the date of this publication and are subject to change without notice. Unless otherwise indicated, Santander does not intend to update this publication. The views and commentary in this publication may not be objective or independent of the interests of the Trading and Sales functions of Santander, who may be active participants in the markets, investments or strategies referred to herein and/or may receive compensation from investment banking and non-investment banking services from entities mentioned herein. Santander may trade as principal, make a market or hold positions in instruments (or related derivatives) and/or hold financial interest in entities discussed herein. Santander may provide market commentary or trading strategies to other clients or engage in transactions which may differ from views expressed herein. Santander may have acted upon the contents of this publication prior to you having received it.
This publication is intended for the exclusive use of the recipient and must not be reproduced, redistributed or transmitted, in whole or in part, without Santander’s consent. The recipient agrees to keep confidential at all times information contained herein.


