By the Numbers
Agency Servicer Prepayment Rankings
This material is a Marketing Communication and does not constitute Independent Investment Research.
A frequent concern in agency prepayments is the impact of the servicer of a pool on prepayments. If that servicer is also an originator, they have an incentive to solicit the borrower to refinance to prevent the borrower from prepaying with another lender and thereby losing the mortgage servicing rights (MSR) associated with that loan. Some servicers have proven very “efficient” at this solicitation.
In this article we describe the methodology we use to differentiate servicer prepayments and provide a simple example to illustrate the process. Then we will discuss some of the benefits and limitations of the approach.
Methodology
The core difficulty for comparing speeds from one servicer to the next is that each servicer’s loan characteristics are potentially different. For example, it is pretty obvious you wouldn’t compare one servicer’s 7/1s with another servicer’s 30-year mortgages. Similarly, one has to account for different coupon and vintage distributions. Furthermore, in order to truly get to the pure impact of the servicer, you would want to account for all other factors that drive prepayments—loan size, LTV, FICO, TPO % (third-party originator %), and so on.
One way to do this is to run a prepayment model for each servicer’s pools, and see if speeds were faster or slower than the model predicts for every servicer. However, this assumes that the model covers all important attributes and, more importantly, that the model is perfectly accurate—overall, and across all the included factors. But no model is perfect.
Another approach, and the one we took, doesn’t require a model. Instead, we compare each servicer’s pools to the universe of comparable pools. By definition, this benchmark is “accurate”, since it is constructed from actual prepayments. On the other hand it isn’t possible to incorporate nearly as many prepayment factors as a model. On balance, though, we feel this the proper trade-off.
For fixed rate pools, we chose to compare cohorts comprised of the product type (30-year, 15-year), coupon, vintage, and a few specified pool categories (principally loan balance and MHA pools). For hybrid pools we only look at product type (5/1, 7/1, etc.), coupon, and vintage. Also, although we will discuss this as if each pool is single-servicer, our rankings incorporate pools with multiple servicers.
Therefore, each pool is mapped to the speed of the cohort of pools with the same product type, coupon, vintage (and specified pool type). To get the servicer’s overall prepayment speed, we aggregate the individual pool speeds, weighted by the outstanding balance of each pool. To get the overall reference speed, we aggregate the speed that was mapped to each pool, weighted by the same weights as the actual pool speeds. This means that each servicer is given a customized reference speed to compare to, based on the specific portfolio of pools they service.
Example
An example should make this clearer. To keep things simple we’ll use a universe of three servicers with a handful of cohorts, with the speeds shown in the exhibit below:
Figure 1:
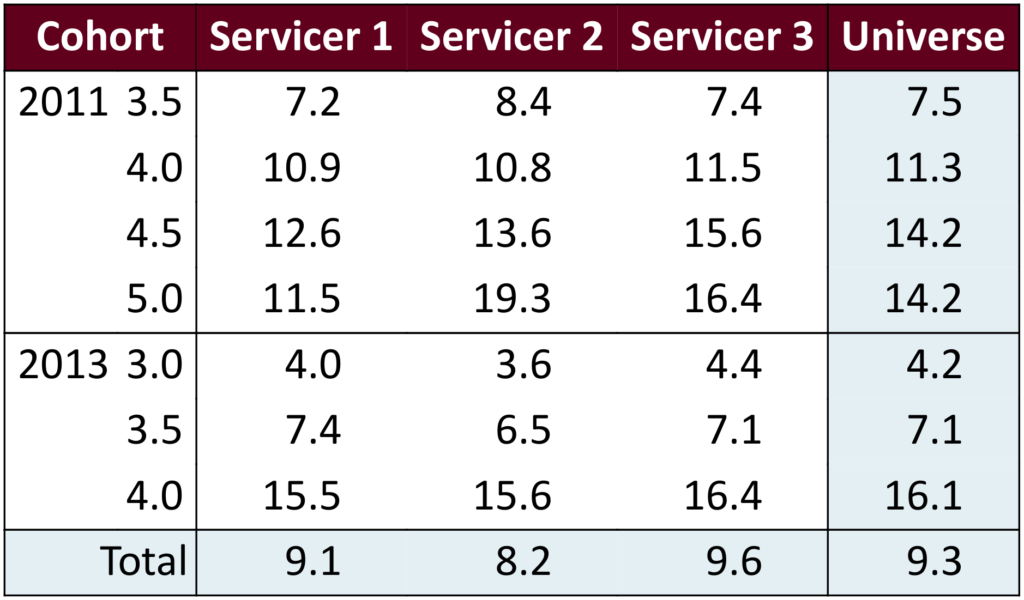
Source: Santander US Capital Markets
The numbers in the “Universe” column, which represent the overall speed of each cohort, are the speeds we will use to benchmark each servicer. At first glance, it appears that Servicer 2 might be the best (slowest) servicer, with its overall speed of 8.2 CPR much slower than the overall speed of 9.3 CPR. But we’ll see that this is not the case.
First, let’s step through the calculations for Servicer 1:
Figure 2:
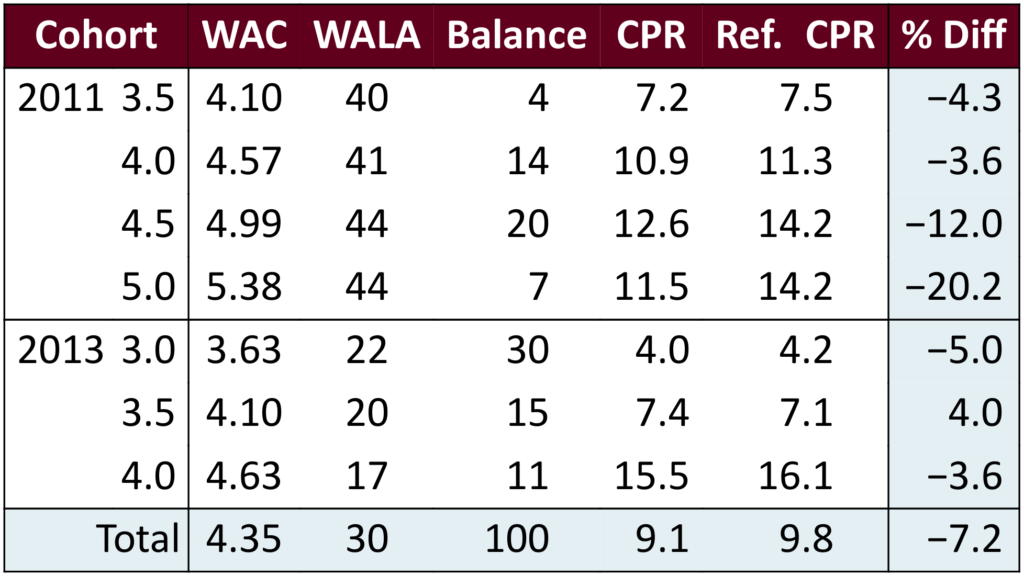
Source: Santander US Capital Markets
In each row we print the servicer’s outstanding balance and actual CPR for that cohort as well as the “reference CPR”, which is a direct lookup of the universe CPR in the first table for that cohort. The last column shows the % difference between the two speeds (negative numbers ⇒ the servicer is slower; note that calculations are done on SMM, not CPR). In the bottom row we show the aggregate speeds, and in the bottom-right corner show the aggregate % difference; this number, −7.2% in this case, is what we will use to rank the servicers.
The next tables show that Servicer 2, although the slowest servicer in terms of absolute speed at 8.2 CPR, actually scores at −4.1%, which is faster than Servicer 1’s −7.2%. Servicer 3 ends up ranking fastest at +4.5%.
Figure 3: Servicer 2 Detail
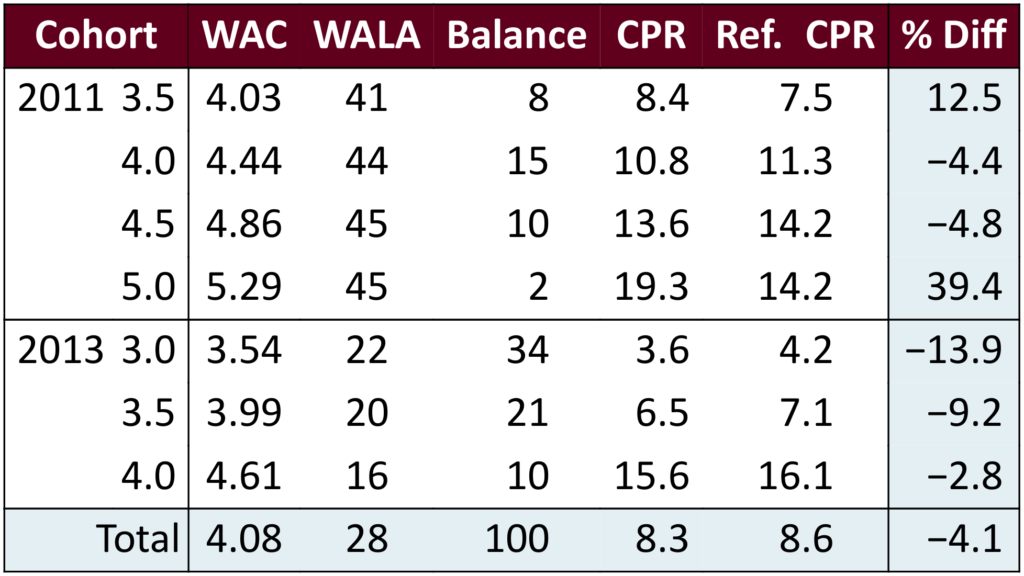
Source: Santander US Capital Markets
Figure 4: Servicer 3 Detail
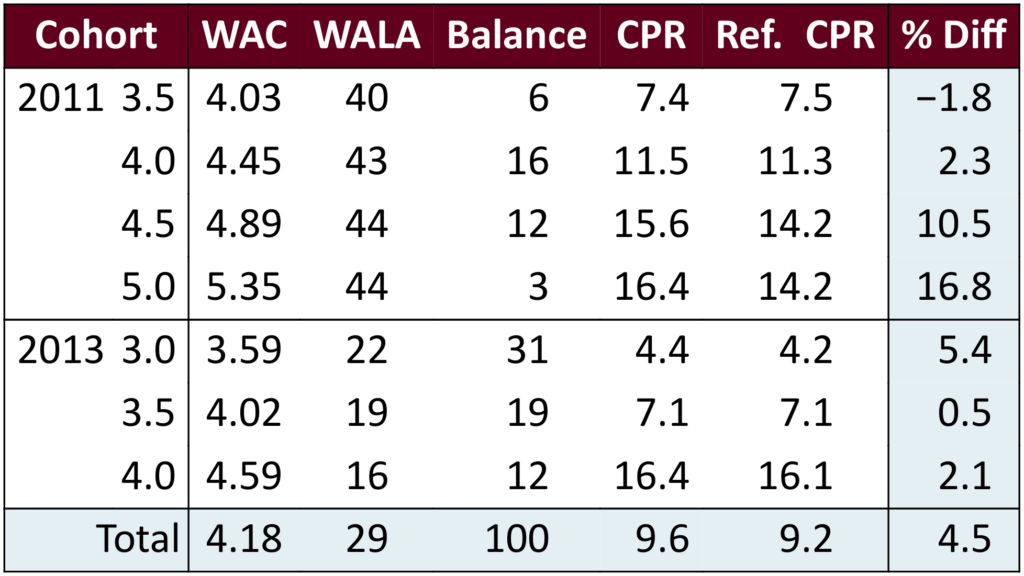
Source: Santander US Capital Markets
This material is intended only for institutional investors and does not carry all of the independence and disclosure standards of retail debt research reports. In the preparation of this material, the author may have consulted or otherwise discussed the matters referenced herein with one or more of SCM’s trading desks, any of which may have accumulated or otherwise taken a position, long or short, in any of the financial instruments discussed in or related to this material. Further, SCM may act as a market maker or principal dealer and may have proprietary interests that differ or conflict with the recipient hereof, in connection with any financial instrument discussed in or related to this material.
This message, including any attachments or links contained herein, is subject to important disclaimers, conditions, and disclosures regarding Electronic Communications, which you can find at https://portfolio-strategy.apsec.com/sancap-disclaimers-and-disclosures.
Important Disclaimers
Copyright © 2026 Santander US Capital Markets LLC and its affiliates (“SCM”). All rights reserved. SCM is a member of FINRA and SIPC. This material is intended for limited distribution to institutions only and is not publicly available. Any unauthorized use or disclosure is prohibited.
In making this material available, SCM (i) is not providing any advice to the recipient, including, without limitation, any advice as to investment, legal, accounting, tax and financial matters, (ii) is not acting as an advisor or fiduciary in respect of the recipient, (iii) is not making any predictions or projections and (iv) intends that any recipient to which SCM has provided this material is an “institutional investor” (as defined under applicable law and regulation, including FINRA Rule 4512 and that this material will not be disseminated, in whole or part, to any third party by the recipient.
The author of this material is an economist, desk strategist or trader. In the preparation of this material, the author may have consulted or otherwise discussed the matters referenced herein with one or more of SCM’s trading desks, any of which may have accumulated or otherwise taken a position, long or short, in any of the financial instruments discussed in or related to this material. Further, SCM or any of its affiliates may act as a market maker or principal dealer and may have proprietary interests that differ or conflict with the recipient hereof, in connection with any financial instrument discussed in or related to this material.
This material (i) has been prepared for information purposes only and does not constitute a solicitation or an offer to buy or sell any securities, related investments or other financial instruments, (ii) is neither research, a “research report” as commonly understood under the securities laws and regulations promulgated thereunder nor the product of a research department, (iii) or parts thereof may have been obtained from various sources, the reliability of which has not been verified and cannot be guaranteed by SCM, (iv) should not be reproduced or disclosed to any other person, without SCM’s prior consent and (v) is not intended for distribution in any jurisdiction in which its distribution would be prohibited.
In connection with this material, SCM (i) makes no representation or warranties as to the appropriateness or reliance for use in any transaction or as to the permissibility or legality of any financial instrument in any jurisdiction, (ii) believes the information in this material to be reliable, has not independently verified such information and makes no representation, express or implied, with regard to the accuracy or completeness of such information, (iii) accepts no responsibility or liability as to any reliance placed, or investment decision made, on the basis of such information by the recipient and (iv) does not undertake, and disclaims any duty to undertake, to update or to revise the information contained in this material.
Unless otherwise stated, the views, opinions, forecasts, valuations, or estimates contained in this material are those solely of the author, as of the date of publication of this material, and are subject to change without notice. The recipient of this material should make an independent evaluation of this information and make such other investigations as the recipient considers necessary (including obtaining independent financial advice), before transacting in any financial market or instrument discussed in or related to this material.
Important disclaimers for clients in the EU and UK
This publication has been prepared by Trading Desk Strategists within the Sales and Trading functions of Santander US Capital Markets LLC (“SanCap”), the US registered broker-dealer of Santander Corporate & Investment Banking. This communication is distributed in the EEA by Banco Santander S.A., a credit institution registered in Spain and authorised and regulated by the Bank of Spain and the CNMV. Any EEA recipient of this communication that would like to affect any transaction in any security or issuer discussed herein should do so with Banco Santander S.A. or any of its affiliates (together “Santander”). This communication has been distributed in the UK by Banco Santander, S.A.’s London branch, authorised by the Bank of Spain and subject to regulatory oversight on certain matters by the Financial Conduct Authority (FCA) and the Prudential Regulation Authority (PRA).
The publication is intended for exclusive use for Professional Clients and Eligible Counterparties as defined by MiFID II and is not intended for use by retail customers or for any persons or entities in any jurisdictions or country where such distribution or use would be contrary to local law or regulation.
This material is not a product of Santander´s Research Team and does not constitute independent investment research. This is a marketing communication and may contain ¨investment recommendations¨ as defined by the Market Abuse Regulation 596/2014 ("MAR"). This publication has not been prepared in accordance with legal requirements designed to promote the independence of research and is not subject to any prohibition on dealing ahead of the dissemination of investment research. The author, date and time of the production of this publication are as indicated herein.
This publication does not constitute investment advice and may not be relied upon to form an investment decision, nor should it be construed as any offer to sell or issue or invitation to purchase, acquire or subscribe for any instruments referred herein. The publication has been prepared in good faith and based on information Santander considers reliable as of the date of publication, but Santander does not guarantee or represent, express or implied, that such information is accurate or complete. All estimates, forecasts and opinions are current as at the date of this publication and are subject to change without notice. Unless otherwise indicated, Santander does not intend to update this publication. The views and commentary in this publication may not be objective or independent of the interests of the Trading and Sales functions of Santander, who may be active participants in the markets, investments or strategies referred to herein and/or may receive compensation from investment banking and non-investment banking services from entities mentioned herein. Santander may trade as principal, make a market or hold positions in instruments (or related derivatives) and/or hold financial interest in entities discussed herein. Santander may provide market commentary or trading strategies to other clients or engage in transactions which may differ from views expressed herein. Santander may have acted upon the contents of this publication prior to you having received it.
This publication is intended for the exclusive use of the recipient and must not be reproduced, redistributed or transmitted, in whole or in part, without Santander’s consent. The recipient agrees to keep confidential at all times information contained herein.


