


The Big Idea
Who added Treasury, credit, agency and MBS in the first quarter?
Steven Abrahams | June 13, 2025
This document is intended for institutional investors and is not subject to all of the independence and disclosure standards applicable to debt research reports prepared for retail investors. This material does not constitute research.
Growth in investor holdings of the biggest sectors of US debt roughly tracked the pace of nominal GDP in the first quarter or only lagged by a modest amount. Treasury debt and corporate and structured credit tracked while agency debt and MBS lagged. The most aggressive buyers varied by sector, but foreign portfolios continue to play important roles across markets.
Holdings by type of debt
Investors in the first quarter reported the biggest absolute gain in holdings of US Treasury debt, up $817 billion or 3.1% (Exhibit 1). Holdings in corporate and structured credit rose $523 billion, a 3.4% increase. Holdings of agency debt and MBS—the Fed reports both sectors together—rose $202 billion for a 1.8% increase. Commercial paper holdings rose $140 billion, an outsized 11.5% gain. And holdings of municipal securities basically came in flat.
Exhibit 1: Increase in investor holdings through the first quarter of 2025

Source: Federal Reserve Z1 Table L.208, Santander US Capital Markets
To put these growth rates in context, US nominal GDP rose 3.4% in the first quarter. That leaves open market paper growing faster than GDP, Treasury securities and credit roughly in line and agency debt and MBS and municipal securities trailing.
Growth in the first quarter left the outstanding US debt securities market at $62.6 trillion. Treasury debt continues to dominate with a 45.4% share followed by credit at 26.1% (Exhibit 2). Agency debt and MBS comes next at 19.6% with municipal securities well behind at 6.8% and open market paper, mainly commercial paper, at 2.2%.
Exhibit 2: Treasury debt dominates US debt securities by a wide margin
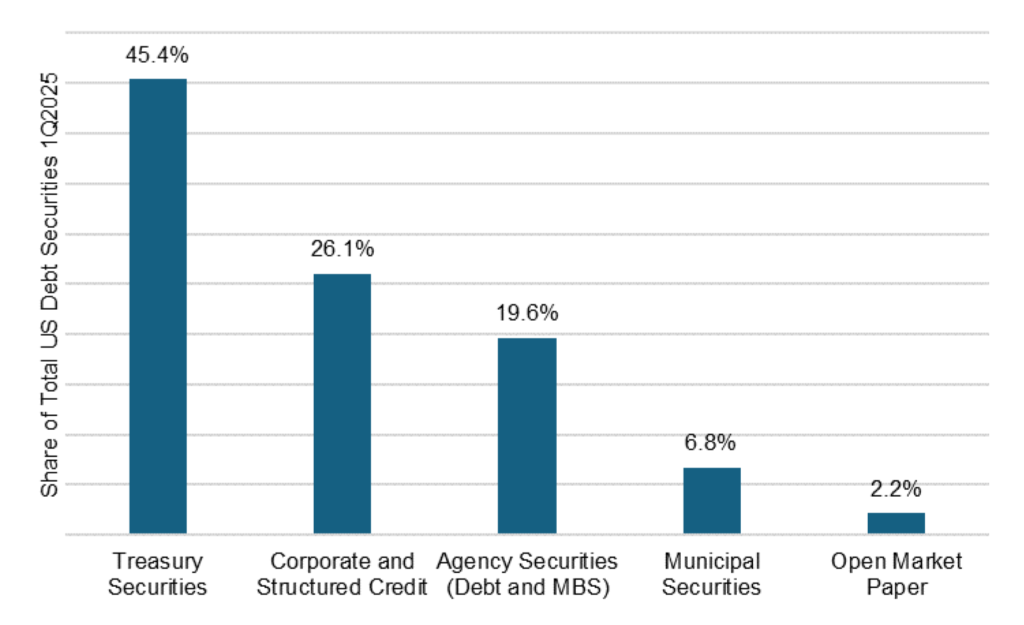
Source: Federal Reserve Z1 Table L.208, Santander US Capital Markets
Rates of growth in Treasury holdings
Within the Treasury market, foreign investors and a host of other smaller portfolios ranging from insurers to ETFs grew faster than the overall Treasury market’s 3.1% pace (Exhibit 3). These numbers reflect markets before Liberation Day and the apparent rotation of capital out of Treasury debt. Households and nonprofits, which includes hedge funds and is a catch-all category used by the Fed for holdings not accounted for elsewhere, also outpaced the overall market. Investors trailing the overall Treasury market included mutual funds, state and local government portfolios, US banks and the Fed. Money market funds, which invest exclusively in Treasury bills, saw holdings drop 3.8%.
Exhibit 3: Foreign Treasury holdings grew faster than the overall market in 1Q25

Note: Investors with at least 5% share of outstanding US Treasury debt.
Source: Federal Reserve Z1, Table L.210, Santander US Capital Markets
Rates of growth in credit
In corporate and structured credit, ETFs, a range of other smaller portfolios and P&C insurance portfolios all grew faster than the market’s overall 3.4% rate (Exhibit 4). The laggards included foreign portfolios, life insurers, mutual funds and private pensions.
Exhibit 4: The biggest holders of credit lagged the pace of market growth
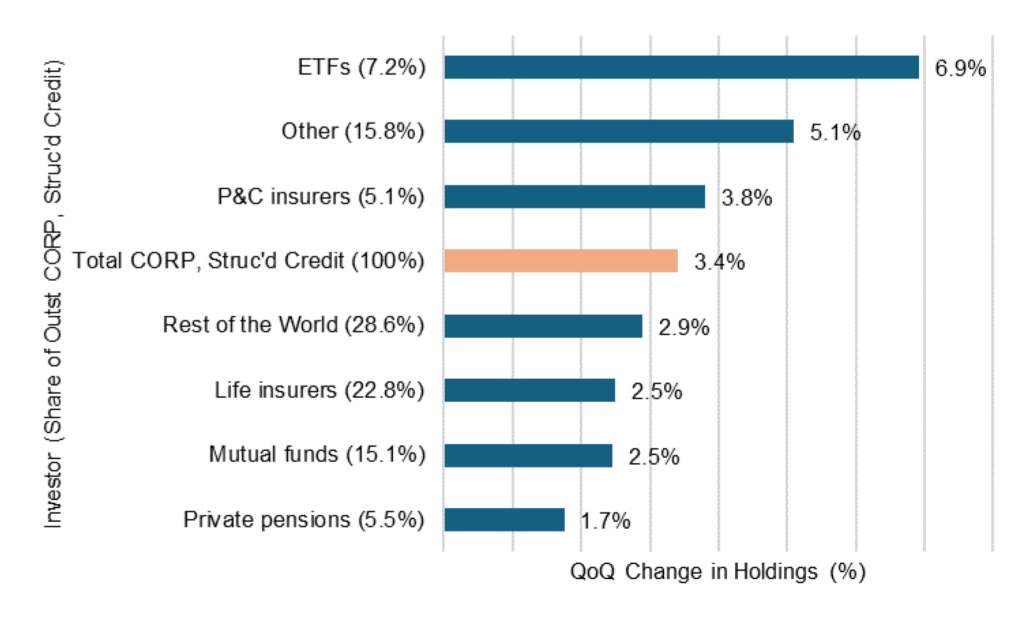
Note: Investors with at least 5% share of outstanding US agency debt and MBS.
Source: Federal Reserve Z1, Table L.213, Santander US Capital Markets
Rates of growth in agency debt and MBS
In agency debt and MBS, growth in brokers’ holdings in the first quarter far outstripped other investors and the overall market, although brokers held only 5% of outstanding securities (Exhibit 5). Broker holdings grew 22.7% while the overall market grew 1.8%. Other small portfolios along with US banks and money market funds, which invest only in agency discount notes, also topped the overall pace of market growth. Laggards included mutual funds, foreign portfolios and the Fed. Households and nonprofits, again a catch-all category for balances not accounted for elsewhere, showed a 7.8% decline.
Exhibit 5: Agency debt and MBS
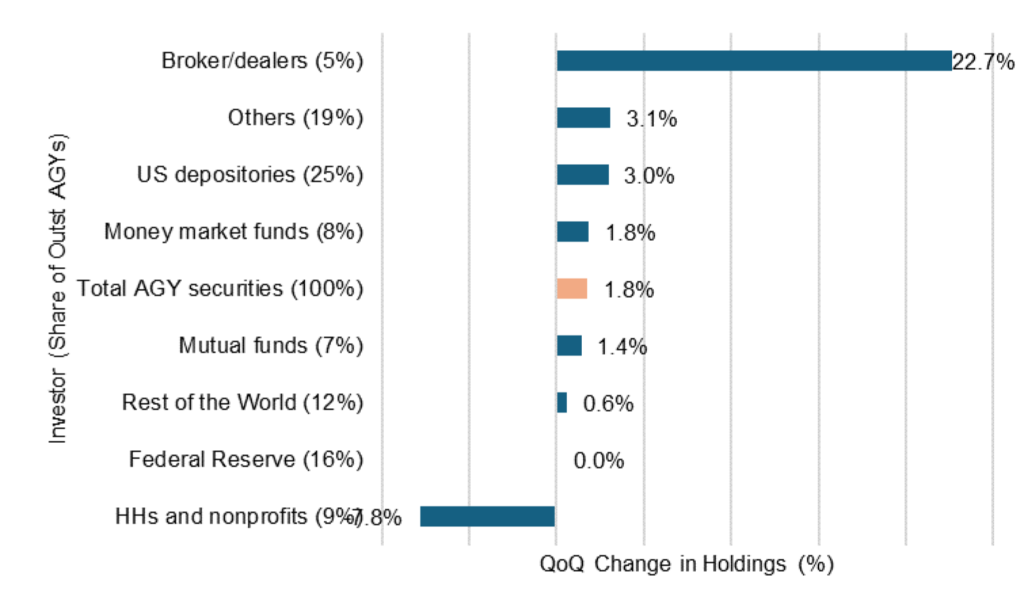
Note: Investors with at least 5% share of outstanding US agency debt and MBS.
Source: Federal Reserve Z1, Table L.211, Santander US Capital Markets
The second quarter should be telling
A full Fed accounting of changes in investor holdings, due out in mid-September, should provide the first complete picture of any changes in the aftermath of Liberation Day. Results in the Treasury market should be available before that from the Treasury International Capital System. The latest picture of the global portfolio in US debt may be the last before new US trade policy began to shape investor thinking.
* * *
The view in rates
The market closed on Friday pricing fed funds at 3.82% to end the year, only 6 bp below the Fed’s March dots. The close agreement reflects a series of messages from Fed speakers about the risk of inflation from tariffs. Recent benign inflation readings have lowered market expectations a few basis points. The Fed looks prepared to wait until it has a better view of whether tariffs will bring a 1-time price change or more persistent inflation
Moody’s downgrade of the US from ‘AAA’ to ‘Aa1’ on May 17 has almost certainly led more investors to focus on US fiscal policy and debt and the broader stability of other US policy. Debt-to-GDP is at 100% and expected to grow over the next decade to 117%. The CBO estimates the budget bill moving through Congress in its current form could add $2.4 trillion to the deficit by 2034. It all promises to add term premium to the yield curve, steepening the curve.
Other key market levels:
- Fed RRP balances rose to $168 billion as of Friday, up $19 billion over the week. Balances lately have been rising, possibly reflecting rising demand for repo from money market funds, where AUM recently crossed back above $7 trillion.
- Setting on 3-month term SOFR closed Friday at 432 bp, up 1 bp in the last week.
- Further out the curve, the 2-year note traded Friday at 3.95%, down 9 bp in the last week. The 10-year note traded at 4.40%, down 11 bp in the last week.
- The Treasury yield curve traded Friday with 2s10s at 45 bp, flatter by 2 bp in the last week. The 5s30s traded Friday at 90 bp, steeper by 5 bp over the same period
- Breakeven 10-year inflation traded Friday at 229 bp, down 3 bp in the last week. The 10-year real rate finished the week at 210 bp, down 8 bp in the last week.
The view in spreads
The decision by China and the US to meet in London and discuss trade has taken a bit more risk out of the market after a few weeks of battling over non-tariff barriers. Tariff risk nevertheless looks like a persistent new part of the market landscape. The next big turning point is likely to come in early July when we see what the US and its counterparties do at the end of the first 90-day pause. Steady signals that the US wants to keep making progress suggests the first pause will most likely roll into a second pause. The Bloomberg US investment grade corporate bond index OAS traded on Friday at 84 bp, tighter by 4 bp in the last week. Nominal par 30-year MBS spreads to the blend of 5- and 10-year Treasury yields traded Friday at 152 bp, unchanged in the last week. Par 30-year MBS TOAS closed Friday at 35 bp, tighter by 2 bp in the last week.
The view in credit
Tariffs should weaken most credits assuming slower growth, and hit specific credits hard based on exposure to cross-border trade flows. Excess returns from the first week of tariff war point to the specific sectors more or less exposed to tariff. We have been watching cracks in credit quality at the weaker end of the credit distribution for months. Fundamentals for the average of the distribution continue to look stable. Most investment grade corporate and most consumer balance sheets have fixed-rate funding so falling rates have limited immediate effect. Consumer debt service coverage is roughly at 2019 levels. However, serious delinquencies in FHA mortgages and in credit cards held by consumers with the lowest credit scores have been accelerating. Consumers in the lowest tier of income look vulnerable. The balance sheets of smaller companies show signs of rising leverage and lower operating margins. Leveraged loans also are showing signs of stress, with the combination of payment defaults and liability management exercises, or LMEs, often pursued instead of bankruptcy, back to 2020 post-Covid peaks. If the Fed only eases slowly this year, fewer leveraged companies will be able to outrun interest rates, and signs of stress should increase. LMEs are very opaque transactions, so a material increase could make important parts of the leveraged loan market hard to evaluate.