The Long and Short
Finding relative value beyond financials
This material is a Marketing Communication and does not constitute Independent Investment Research.
With investment grade corporate bond spreads continuing to trade at the tight end of their 5-year range, even in the face of recent US Treasury volatility, investors should take a close look at relative value. Financials still look like the most attractive broad sector. But media entertainment, cable satellite, aerospace/defense and automotive also look appealing. And each sector includes at least a name or two that clearly stand out.
Financials still look relatively attractive
For the past several months, financial sectors have traded between the 22nd and 32nd percentile of their 5-year spread range (Exhibit 1). Other sectors have traded much tighter. Basic industry, for example, trades at the 0th percentile of it 5-year range, meaning it trades at the tightest spreads in the last five years. Other sectors trade similarly tight. Others only modestly wider. However, by drilling down a layer deeper, investors can find attractive corners of the non-financial market.
Exhibit 1: Investment grade sector spread percentile ranks
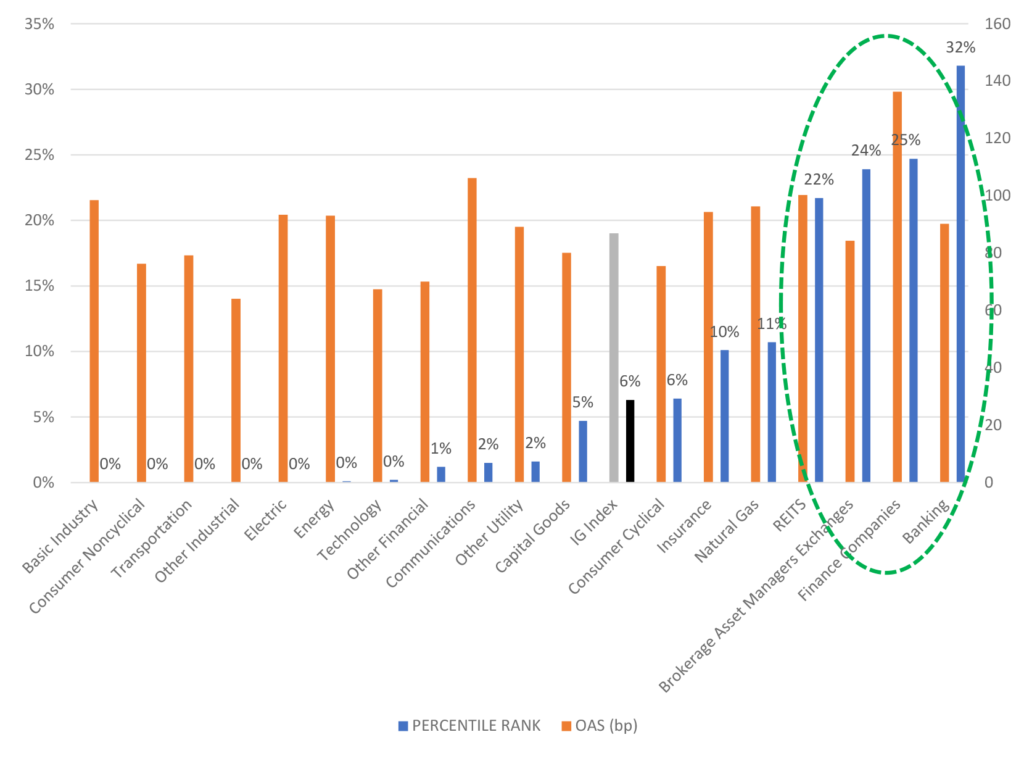
Note: Data show absolute current OAS and OAS as a percentile of its 5-year range.
Source: Santander US Capital Markets LLC, Bloomberg/Barclays US corporate sector indices
Outside of financials, media, cable and others look appealing
A vast amount of non-financial subsectors are registering zero or near-zero percentiles, demonstrating that comparative spreads are trading at or near their five-year historical tights (Exhibit 2). A few segments are still offering a degree of value relative to historic performance. Among the top-ranking subsectors are media entertainment, cable satellite, aerospace/defense and automotive. Although construction machinery lands among the Top 5 by this metric, its collective nominal option-adjusted spread (OAS) lands at the lowest of any other segment within the investment grade landscape, and therefore is excluded among the top relative value picks for the purposes of this study.
Exhibit 2: Non-financial subsector spread percentile
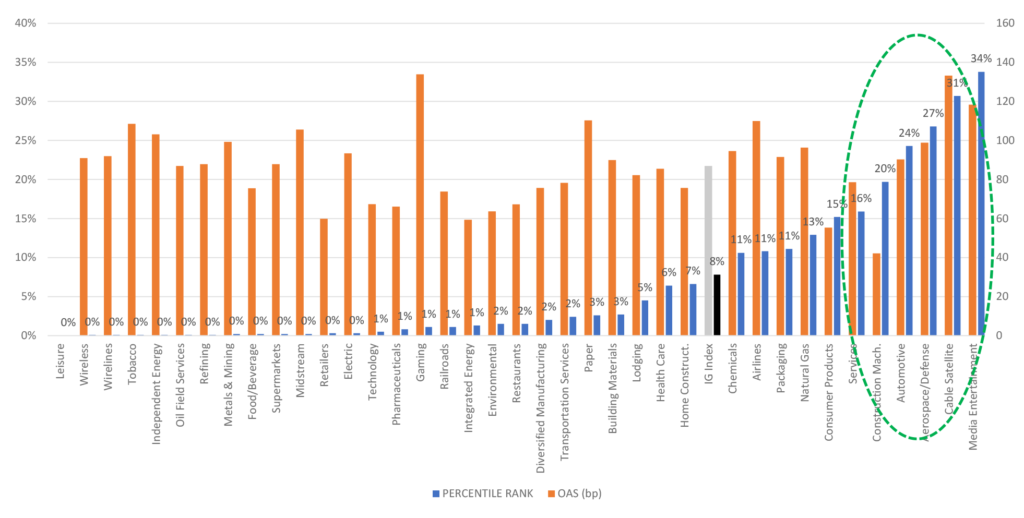
Note: Data show absolute current OAS and OAS as a percentile of its 5-year range.
Source: Santander US Capital Markets LLC, Bloomberg/Barclays US corporate sector indices
Within media entertainment, Warner Bros. Discovery
Much of the spread valuation that appears to be reflected in the media entertainment segment is being generated by spread weakness is Paramount Global (PARA: Baa3/BB+/BBB-), which is currently teetering on the brink of IG and crossover. There is significant event risk in the form of multiple suitors (Apollo, Skydance and others) reportedly seeking a deal with the media conglomerate, with uncertain outcomes for bondholders. A more stable credit opportunity in the segment is offered by Warner Brothers Discovery (WBD: Baa3/BBB-/BBB-), which saw spreads gap out during the strikes of late 2023 but has been steadily recovering in more recent months. Management appears committed to debt reduction, and maintenance of solid investment grade credit metrics appears a much more certain outcome for bondholders.
Exhibit 3: Media entertainment spread curve
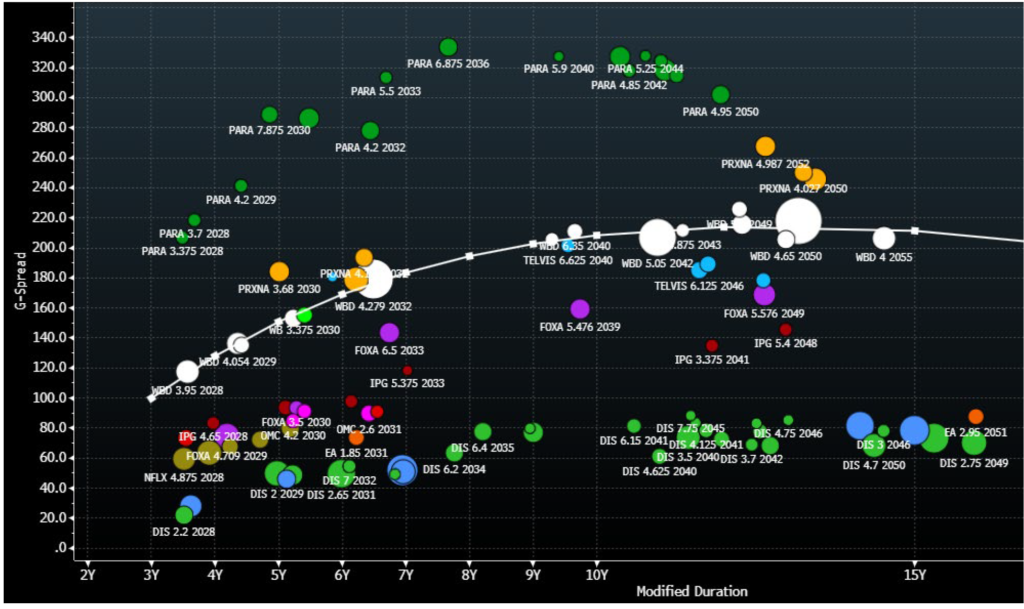
Source: Santander US Capital Markets LLC, Bloomberg/TRACE YAS G-spread indications only
Within cable satellite, Charter Communications
Similarly, in the widest trading credit in the cable satellite segment, Charter Communications (CHTR: Ba1/BBB-/BBB-) also continues to be on what appears to be a course correction as management also remains committed to the maintenance of IG credit ratings for the secured debt obligations. CHTR is the second largest cable company to CMCSA in the US and maintains leverage at the secured level in the 3.0-3.5x range, which is only a modest roughly half turn of leverage above of their larger competitor, which trades at considerably tighter spread levels.
Exhibit 4: Cable satellite spread curve
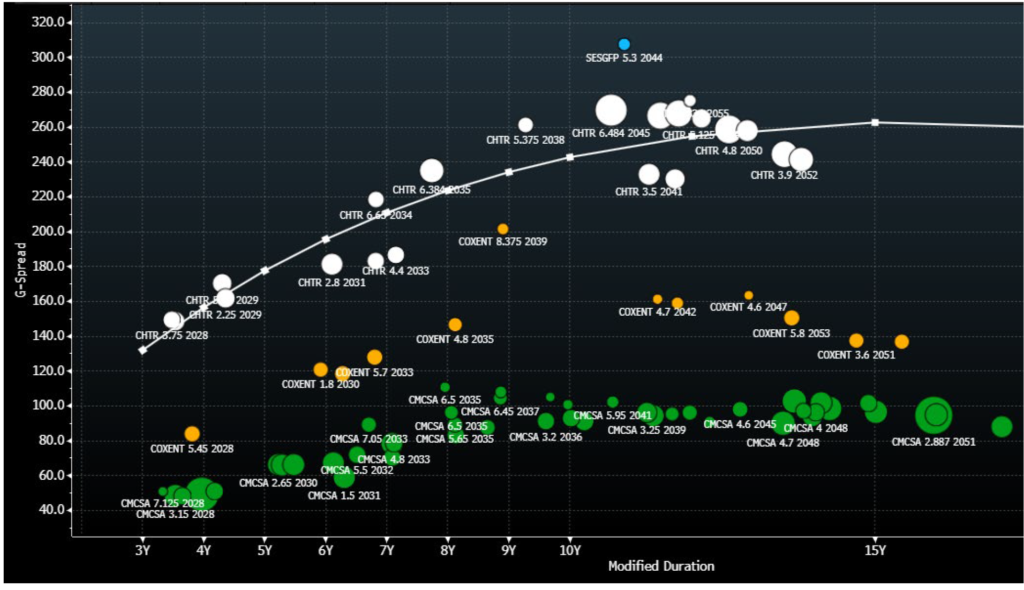
Source: Santander US Capital Markets LLC, Bloomberg/TRACE YAS G-spread indications only
Within aerospace/defense, L3Harris Technologies
Like the media segment, much of the perceived spread opportunity in aerospace/defense is being generated from one specific credit – not surprisingly that credit is Boeing (BA: Baa2*-/BBB-/BBB-), which continues to face an onslaught of issues related to safety concerns and more recent reductions in orders from the larger carriers. Alternatively, L3Harris Technologies (LHX: Baa2/BBB/BBB) is currently in the process of deleveraging its balance sheet after making a string of acquisitions (Tactical Datalink, Aerojet and others) in previous years. Management is seeking to bring leverage down below 3x from more than 4x and has shareholder remuneration on temporary hold until it can achieve that target. The rating agencies negative outlooks (since late 2022) would be resolved after management makes good on its commitment to improve the balance sheet.
Exhibit 5: Aerospace/Defense spread curve
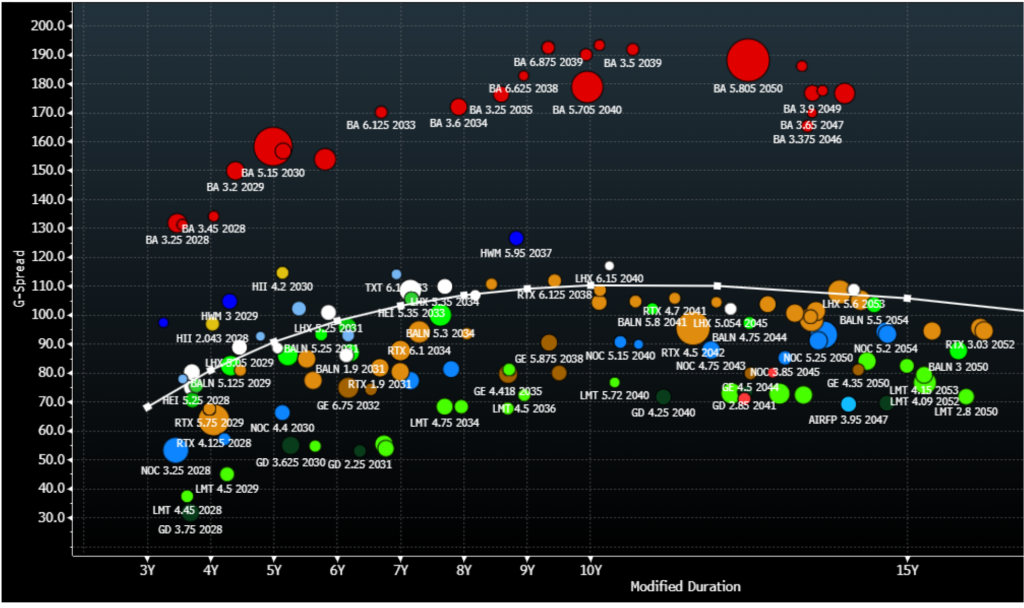
Source: Santander US Capital Markets LLC, Bloomberg/TRACE YAS G-spread indications only
Within automotive, Ford and GM
Within the automotive segment, the domestic OEMs have started to generate significant operating moment that could translate to notably stronger credit stability. Overweighting those names relative to the rest of the peer group appears the best means to maximize spread opportunity in one of the few non-financial segments trading meaningfully above their five-year tights. Ford (F: Ba1/BBB-/BBB-) has provided upbeat guidance for full-year 2024 in key categories that could eventually see them achieve the elusive third IG rating from Moody’s over the near-term. Likewise, General Motors’ (GM: Baa2/BBB/BBB) full-year guidance beat expectations and appears to be turning a corner in EV categories.
Exhibit 6: Automotive spread curve
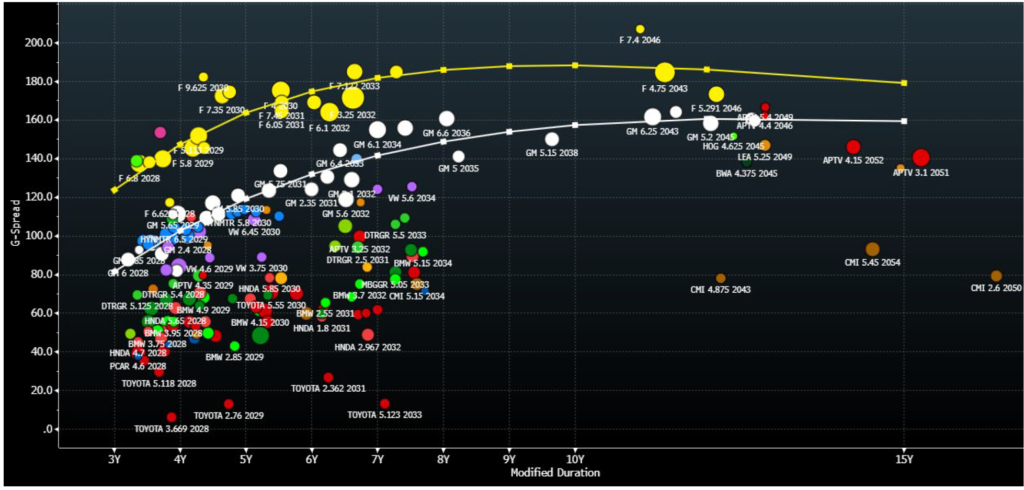
Source: Santander US Capital Markets LLC, Bloomberg/TRACE YAS G-spread indications only
This material is intended only for institutional investors and does not carry all of the independence and disclosure standards of retail debt research reports. In the preparation of this material, the author may have consulted or otherwise discussed the matters referenced herein with one or more of SCM’s trading desks, any of which may have accumulated or otherwise taken a position, long or short, in any of the financial instruments discussed in or related to this material. Further, SCM may act as a market maker or principal dealer and may have proprietary interests that differ or conflict with the recipient hereof, in connection with any financial instrument discussed in or related to this material.
This message, including any attachments or links contained herein, is subject to important disclaimers, conditions, and disclosures regarding Electronic Communications, which you can find at https://portfolio-strategy.apsec.com/sancap-disclaimers-and-disclosures.
Important Disclaimers
Copyright © 2026 Santander US Capital Markets LLC and its affiliates (“SCM”). All rights reserved. SCM is a member of FINRA and SIPC. This material is intended for limited distribution to institutions only and is not publicly available. Any unauthorized use or disclosure is prohibited.
In making this material available, SCM (i) is not providing any advice to the recipient, including, without limitation, any advice as to investment, legal, accounting, tax and financial matters, (ii) is not acting as an advisor or fiduciary in respect of the recipient, (iii) is not making any predictions or projections and (iv) intends that any recipient to which SCM has provided this material is an “institutional investor” (as defined under applicable law and regulation, including FINRA Rule 4512 and that this material will not be disseminated, in whole or part, to any third party by the recipient.
The author of this material is an economist, desk strategist or trader. In the preparation of this material, the author may have consulted or otherwise discussed the matters referenced herein with one or more of SCM’s trading desks, any of which may have accumulated or otherwise taken a position, long or short, in any of the financial instruments discussed in or related to this material. Further, SCM or any of its affiliates may act as a market maker or principal dealer and may have proprietary interests that differ or conflict with the recipient hereof, in connection with any financial instrument discussed in or related to this material.
This material (i) has been prepared for information purposes only and does not constitute a solicitation or an offer to buy or sell any securities, related investments or other financial instruments, (ii) is neither research, a “research report” as commonly understood under the securities laws and regulations promulgated thereunder nor the product of a research department, (iii) or parts thereof may have been obtained from various sources, the reliability of which has not been verified and cannot be guaranteed by SCM, (iv) should not be reproduced or disclosed to any other person, without SCM’s prior consent and (v) is not intended for distribution in any jurisdiction in which its distribution would be prohibited.
In connection with this material, SCM (i) makes no representation or warranties as to the appropriateness or reliance for use in any transaction or as to the permissibility or legality of any financial instrument in any jurisdiction, (ii) believes the information in this material to be reliable, has not independently verified such information and makes no representation, express or implied, with regard to the accuracy or completeness of such information, (iii) accepts no responsibility or liability as to any reliance placed, or investment decision made, on the basis of such information by the recipient and (iv) does not undertake, and disclaims any duty to undertake, to update or to revise the information contained in this material.
Unless otherwise stated, the views, opinions, forecasts, valuations, or estimates contained in this material are those solely of the author, as of the date of publication of this material, and are subject to change without notice. The recipient of this material should make an independent evaluation of this information and make such other investigations as the recipient considers necessary (including obtaining independent financial advice), before transacting in any financial market or instrument discussed in or related to this material.
Important disclaimers for clients in the EU and UK
This publication has been prepared by Trading Desk Strategists within the Sales and Trading functions of Santander US Capital Markets LLC (“SanCap”), the US registered broker-dealer of Santander Corporate & Investment Banking. This communication is distributed in the EEA by Banco Santander S.A., a credit institution registered in Spain and authorised and regulated by the Bank of Spain and the CNMV. Any EEA recipient of this communication that would like to affect any transaction in any security or issuer discussed herein should do so with Banco Santander S.A. or any of its affiliates (together “Santander”). This communication has been distributed in the UK by Banco Santander, S.A.’s London branch, authorised by the Bank of Spain and subject to regulatory oversight on certain matters by the Financial Conduct Authority (FCA) and the Prudential Regulation Authority (PRA).
The publication is intended for exclusive use for Professional Clients and Eligible Counterparties as defined by MiFID II and is not intended for use by retail customers or for any persons or entities in any jurisdictions or country where such distribution or use would be contrary to local law or regulation.
This material is not a product of Santander´s Research Team and does not constitute independent investment research. This is a marketing communication and may contain ¨investment recommendations¨ as defined by the Market Abuse Regulation 596/2014 ("MAR"). This publication has not been prepared in accordance with legal requirements designed to promote the independence of research and is not subject to any prohibition on dealing ahead of the dissemination of investment research. The author, date and time of the production of this publication are as indicated herein.
This publication does not constitute investment advice and may not be relied upon to form an investment decision, nor should it be construed as any offer to sell or issue or invitation to purchase, acquire or subscribe for any instruments referred herein. The publication has been prepared in good faith and based on information Santander considers reliable as of the date of publication, but Santander does not guarantee or represent, express or implied, that such information is accurate or complete. All estimates, forecasts and opinions are current as at the date of this publication and are subject to change without notice. Unless otherwise indicated, Santander does not intend to update this publication. The views and commentary in this publication may not be objective or independent of the interests of the Trading and Sales functions of Santander, who may be active participants in the markets, investments or strategies referred to herein and/or may receive compensation from investment banking and non-investment banking services from entities mentioned herein. Santander may trade as principal, make a market or hold positions in instruments (or related derivatives) and/or hold financial interest in entities discussed herein. Santander may provide market commentary or trading strategies to other clients or engage in transactions which may differ from views expressed herein. Santander may have acted upon the contents of this publication prior to you having received it.
This publication is intended for the exclusive use of the recipient and must not be reproduced, redistributed or transmitted, in whole or in part, without Santander’s consent. The recipient agrees to keep confidential at all times information contained herein.


